


The market is more expensive today than it was a year ago.
We all hear that, but do we really know what they are talking about? When we read about the average market Price-Earnings Ratio (PE Ratio) going up, what does that really mean? You pay more than you used to. This phenomenon is called “PE expansion.” I’ve built this small guide to tell you what it is and why it has an impact on your portfolio.

A quick review of the PE Ratio
The PE ratio refers to the number of times you pay the profit per share of a company. For example, if a company reports earnings of $1 per share and the stock trades at $11, this means you pay 11 times its profit. In other words, the value of the company is equal to 11 times its profit today. If you own all shares of that company, you would need 11 years to get all of your money back, assuming profit doesn’t change.
What happens when you pay more
Imagine the same company with the same earnings suddenly trades at $13. An affluent of new investors want to buy shares of this company and they are ready to pay a more expensive price ($13). At that time, we are looking at the same company with the same profile and earnings. The only difference is that it costs $2 more per share. The only reason why you pay more today for the stock is because there are more people wanting it.
This could be because they think the company will go through a major breakthrough and that earnings will go up. This could be because interest rates are low and investors are ready to pay a higher price for a solid dividend payer (hence, pushing the yield lower at the same time).
A real-life example
Let’s use 3M Co (MMM) as an example. Here’s a graph showing MMM stock price along with its earnings per share (EPS):
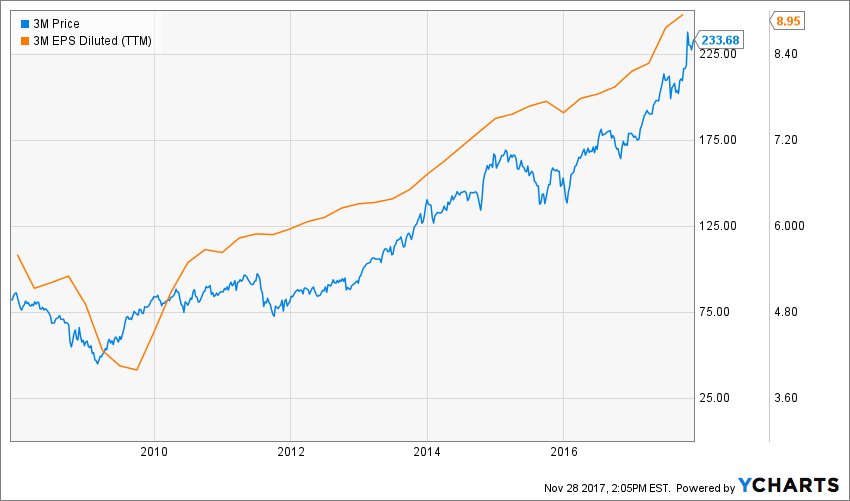
Source: Ycharts
A quick look at such graphs and everything looks normal. The price goes up as the EPS goes up. This would falsely lead us to think that both metrics go up following the same trend. After all, it’s only normal to pay a higher price for a stock that shows a higher EPS, right? When we take both metrics, but look at the normalized variation, we have a totally different landscape:
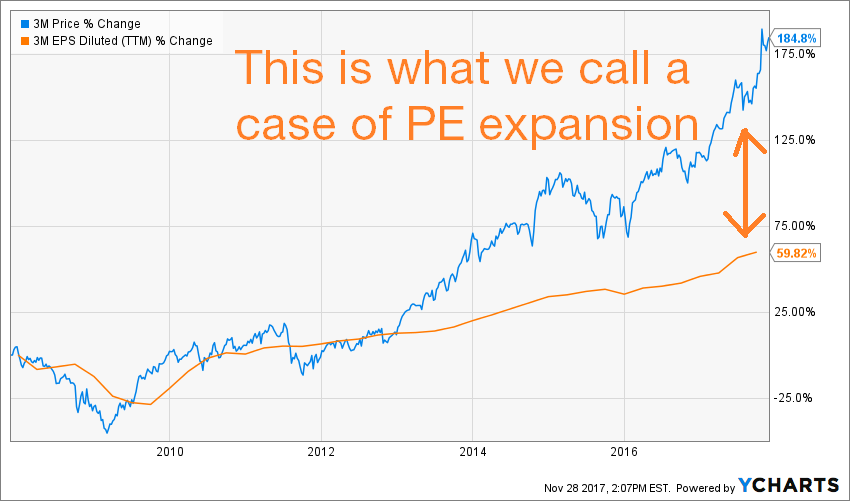
Source: Ycharts
As you can see, the stock price is going up a lot faster than the earnings. You can also see how high MMM PE ratio goes over the past decade:
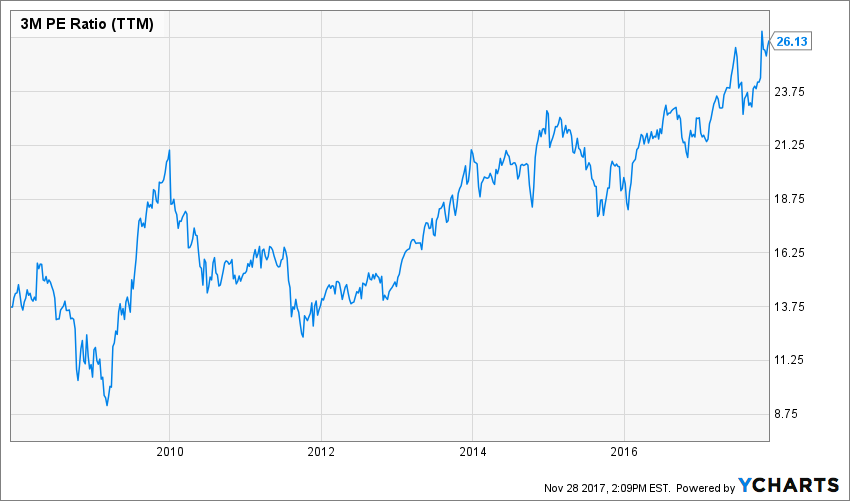
Source: Ycharts
10 years ago, MMM used to trade at 14 times its earnings. Today, it is around 26 times. If MMM was a money making machine it would have required 14 years to recoup your investment if you would have purchased it in 2007. Today, if you buy the upgraded money making machine model (it is upgraded as it makes more money than it used to 10 years ago), you would need 26 years to recoup your investment.
I am not talking about the price paid here, but rather the number of years before the company can technically reimburse you for your investment. If you buy MMM today, you would need to wait 12 more years than if you would have bought it 10 years ago. Does the new money making machine looks attractive compared to the old model? Not really.
Potential opportunities
From time to time, there are opportunities on the stock market where a stock is trading at a lower PE based on fears and false assumptions. A good example would be Apple (AAPL):
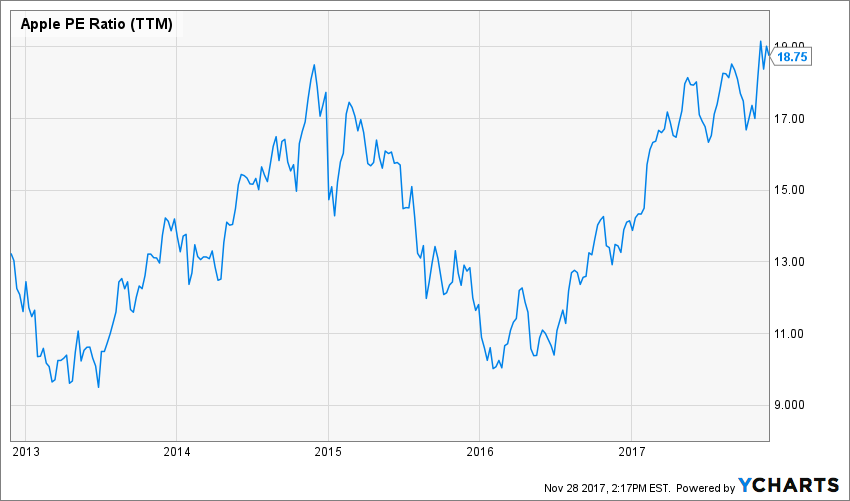
Source: Ycharts
Based on the thesis that Apple would not be competitive in the smartphone industry, AAPL stock dropped close to a 9 PE ratio back in 2013. It happened again in 2016 when investors lost interest in the company. However, paying only 9 times the revenue of a company as solid as Apple is definitely a bargain. It becomes less obvious when it trades around 19 times its earnings.
You can then purchase a stock based on a lower PE ratio in the hopes that there will be a PE expansion. On the other side, you can always buy a stock at a higher PE ratio in the hopes that the company will make more profit in the future and bring down this valuation metric.
Potential risk
When the PE expansion is too important and happens without a good rationale, it could become highly dangerous. When faith in the market starts to fade, higher valued companies will be the first to plunge. Technically, they are the ones that are the farthest to their intrinsic valuation.
As you can see, MMM used to trade over a 26 PE ratio before the latest crisis. You can also note how fast the stock price dropped during the financial crisis:
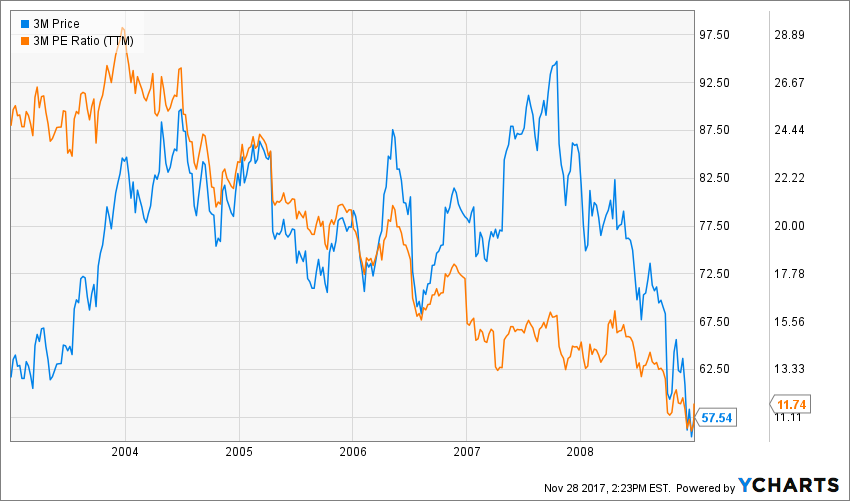
Source: Ycharts
How to prevent it – Using other valuation models
The PE ratio is one valuation model among many others. In order to have a clear view of how the market looks at a company, I like to use a 10 year history. This shows me the PE fluctuations through a longer period and helps me find the most accurate multiplier for that investment. But this is only good to give me a hint about where to look. I rather use a more precise model such as the Discounted Cash Flow and the Dividend Discount Model to find the stock intrinsic value.
By using those models, I am able to not only find a fair value before I make a purchase, but I can also calculate a margin of safety. This is particularly useful when you invest in such a highly valued stock market as today.
Final thoughts
Depending on when you invest and the overall market sentiments, PE ratios could be high or low. The current bullish market has been supported by an unprecedented low interest rate environment and massive cash flow injected by central banks. It is hard to determine if we will enter into a PE contraction phase at one point or if this is now the new norm. As long as there will be faith in the stock market, the bull will continue to ride. In the meantime, I stay invested in strong dividend growth stocks as they always tend to perform well in the long run!
Disclaimer: I’m long MMM & AAPLThis article was written by Dividend Monk. If you enjoyed this article, please subscribe to my feed [RSS]


