


There was a time when finding opportunities on the stock market was like apple picking in September. When the market is up and the economy rolling, companies show amazing numbers. If you look at the past 5 years, many companies show high single digit dividend growth. Using such numbers inside a valuation model could be deadly. Now that investors are much less excited, all the best stock opportunities seem to have faded away.
All I hear is “overvalued”, is this true?
My favorite saying about investments is “buy when there is blood on the street”. This is obviously the best time to buy shares of most companies; when everybody is selling. Unfortunately, this doesn’t happen very often. For example, we had a relatively bad year in 2015, but the overall market didn’t drop like a rock either. A chance to buy solid companies at a fraction of the price like we lived in 2008 is very far from our current situation.
Many investors say the market is currently overvalued. I don’t agree with those investors. When you look at the S&P 500, the current average PE ratio is not unusual:
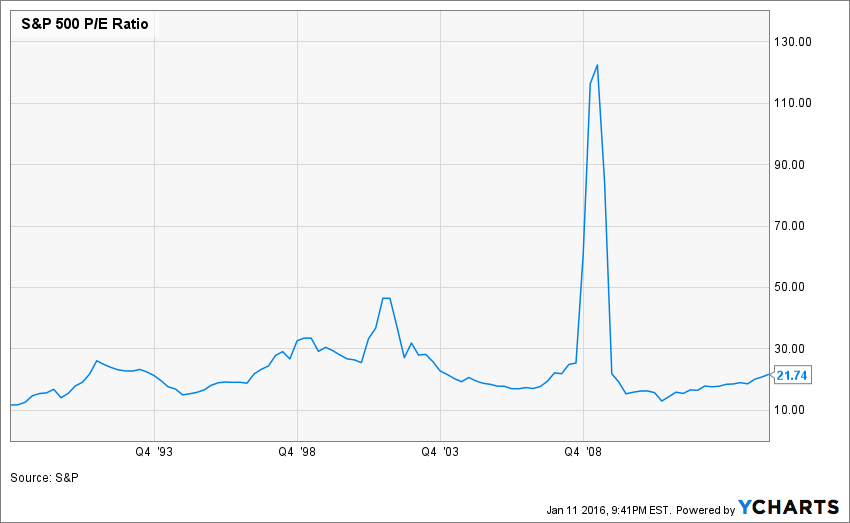
It’s not cheap, but it’s not very expensive either. The thing is that we have entered into a territory where the easy money in the market is gone. Only the “strong will survive”. However, if you keep the same high single dividend growth rate, you will be wrong for many share valuation calculations!
How to adequately select your discount rate
By definition, the discount rate should correspond to your expected rate of return. If you invest in the stock market, you should expect a minimal return of 7-8%. However, if you use such a low discount rate to make up a value using popular models such as the Discounted Cash Flow analysis or the Dividend Discount Model, you will find that pretty much all dividend growth stocks are trading at a discount. This is not true either.
I try to become more selective in my approach. This is why I use a discount rate between 9% and 12%. When a company is in stellar condition, I will use the 9% discount rate. However, this company must show most of the following criteria:
- geographically diversified (being a leader in several countries)
- diversified products (many billion dollar brands)
- solid balance sheet (low debt and high repayment capacity)
- unique economic moat (a competitive advantage nearly impossible to replicate)
- steady and increasing revenue streams
Such companies can be found but they are rare. Most of the time, I find a solid company showing most of those criteria, but there is always something leading me to use a higher discount rate. This is why I pick 10% as a default discount rate. I use 1% less (9%) for exceptional companies and 1% over (11%) for riskier companies. Rarely, but sometimes it happens, I use a 12% discount rate when I think the company has a strong upside potential but also shows some serious issues. I tend to never have more than 10% of my portfolio invested in such companies.
Using a sustainable dividend growth rate
When I see investors using an 8% discount rate, I find it’s not greedy enough. I think they put their investment at risk thinking all their investment will reward them with a 8% return. We all know this is not true and you need stronger picks to compensate. This is why using a 10% discount rate will push many companies aside at the valuation stage.
A similar thinking should be applied toward dividend growth rates. I like using the double stage dividend discount model calculation as I can use 2 different rates. A first one that will be good for the first 10 years and another one that will be used forever after. The first rate could be more generous if it reflects the current situation of a company. When a business is growing in a flourishing economy, we can believe it will become more generous with its shareholders for the time being. After that, it is time to become more reasonable and expect a more conservative rate. The idea is to find the balance between the past 5 years that has simply been amazing and the next 25 years where we can’t really know what will happen.
The Dividend Discount Model – a Real-life example
In order to illustrate how I use the double stage dividend discount model (you can check the excel spreadsheet here), I’m showing you how I analyze the value of a well-known company; Johnson & Johnson (JNJ).
As the company shows most of my “stellar company” traits mentioned above, I will use a discount rate of 9%. JNJ is operating in over 100 countries, owns several billion dollar brands, benefits from serious competitive advantages and shows a growth potential in its revenues considering the aging population.
Then, over the past 5 years, the company shows a 7.42% CAGR dividend growth rate. I decided to use a 7.5% for the first 10 years as I think the company will be able to maintain this increase rate over the next few years. The current payout ratio is relatively low at 54-55% and both revenues and earnings show growing potential. However, it would be unrealistic to think the company could sustain such high dividend growing rate. Due to its impressive dividend growth history, I’ve used a 6% dividend growth rate after the first ten years. The data I used in my spreadsheet are showed as follow:
| Input Descriptions for 15-Cell Matrix | INPUTS | ||||
| Enter Recent Annual Dividend Payment: | $3.00 | ||||
| Enter Expected Dividend Growth Rate Years 1-10: | 7.50% | ||||
| Enter Expected Terminal Dividend Growth Rate: | 6.00% | ||||
| Enter Discount Rate: | 9.00% | ||||
Then, the spreadsheet gives me all the calculation I need to take my investing decision:
| Calculated Intrinsic Value OUTPUT 15-Cell Matrix | |||
| Discount Rate (Horizontal) | |||
| Margin of Safety | 8.00% | 9.00% | 10.00% |
| 20% Premium | $217.24 | $144.13 | $107.60 |
| 10% Premium | $199.14 | $132.11 | $98.63 |
| Intrinsic Value | $181.04 | $120.10 | $89.67 |
| 10% Discount | $162.93 | $108.09 | $80.70 |
| 20% Discount | $144.83 | $96.08 | $71.73 |
As you can see, the company is fairly valued at $120. Since the company is more trading around $100 these days, there is a 20% discount on the price. However, this is assuming my expectations are right. If I simply drop my dividend growth rate by 1% for each period (therefore 6.50% for 10 years and then 5%), I get the following values:
| Calculated Intrinsic Value OUTPUT 15-Cell Matrix | |||||||
| Discount Rate (Horizontal) | |||||||
| Margin of Safety | 8.00% | 9.00% | 10.00% | ||||
| 20% Premium | $142.92 | $106.69 | $84.98 | ||||
| 10% Premium | $131.01 | $97.80 | $77.90 | ||||
| Intrinsic Value | $119.10 | $88.91 | $70.81 | ||||
| 10% Discount | $107.19 | $80.02 | $63.73 | ||||
| 20% Discount | $95.28 | $71.13 | $56.65 | ||||
Suddenly, the company is now considered being traded at a 30% premium!
Valuation models are tools, but they should not be at the center of your investment process
I really like using the DDM to determine if a company share price makes sense or not. However, I know I can’t solely base my buying or selling decisions on a group of assumptions that have been put together. No matter how much time I spend on my analysis and how good I could be, there are tons of events that are out of my control. In JNJ’s case, a new “miracle” drug against diabetes could drastically affect JNJ sales and transform the company. It’s a good thing if JNJ is the owner of this new drug… but a it’s a terrible fate if it is discovered by one of its competitors!
The secret in doing stock valuation is always to remain conservative to make sure your assumptions are realistic and to require a relatively high return on your investments. You can rarely be wrong if you follow such rules.This article was written by Dividend Monk. If you enjoyed this article, please subscribe to my feed [RSS]


