


Summary
#1 I believe financials will continue to be strong in 2018 and TROW will be part of the party.
#2 TROW is a dividend aristocrat with 31 years of dividend increase under its belt.
#3 In 2018, TROW will reach 1 trillion dollars in assets under management.
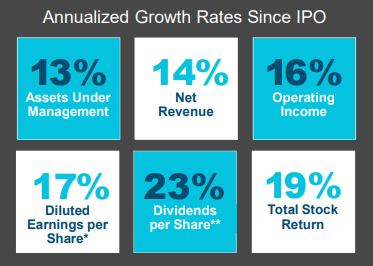
I must admit, I rarely let one fly under my radar. But this time, I feel that T. Rowe Price (TROW) did the trick. While the stock has remained dormant for about 4 years, 2017 was a big wake-up for investors. Between January 2013 and January 2017, TROW lagged the S&P 500 by about 40% (15.58% vs 56.98%). However, TROW jumped by 40% in 2017. It seems the asset manager is unlocking value after being ignored by the market for a while. Is it the result of an overheating bullish market looking for new preys or is it really because TROW has shown some impressive results since the very beginning but we just didn’t see it? After all, TROW has been a model of performance since its IPO back in 1986:
Understanding the Business
T. Rowe Price is one of the world largest asset managers with $991 billion in assets under management (as at November 30th 2017). What really matters for assets managers is obviously how much they manage (Assets Under Management, AUM) as they are making fees on investors nest egg. By comparison, Blackrock (BLK), the world largest asset manager, shows 5.7 trillion.
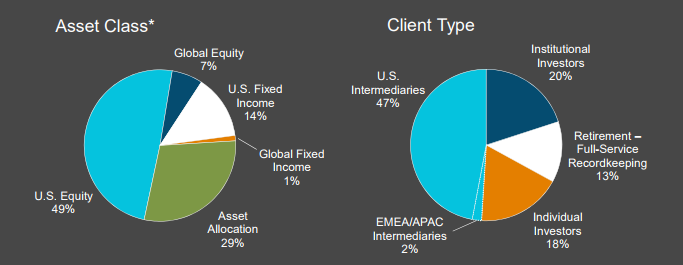
T.Rowe Price shows a classic model with a wide variety of investing products going from fixed income to equity. The bulk of its business is done through financial intermediaries (third parties such as financial institutions selling its products) and institutional investors.
Revenues
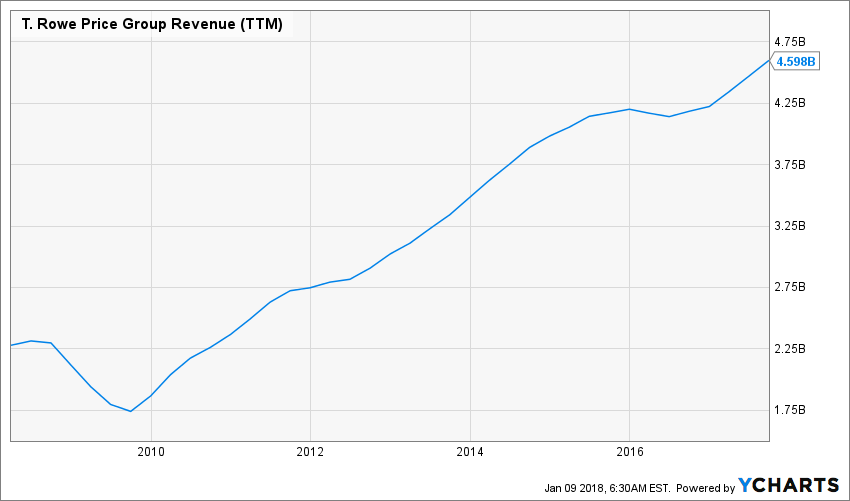
Source: Ycharts
TROW has been quick in focusing on retirement products and started defined contribution plans back in 1982. Now that most employers shifted retirement planning in the hand of their employees, TROW is well positioned to surf on this tailwind. As population ages and the need to plan for retirement have become crucial, TROW will definitely be an active player in the upcoming years.
Another growth vector comes from TROW past performances. WE all know that past performance is not a guarantee of future returns, but if you have to invest $2 on a pony, you will take one that already won a few races, right? As at its latest quarter (Sept 30th, 2017) TROW shows a remarkable performance:
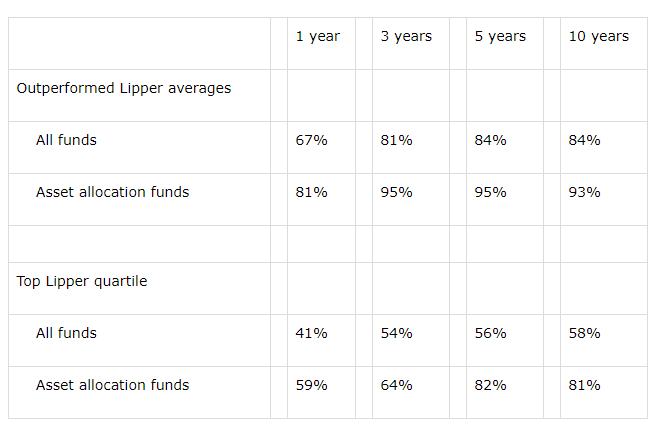
Finally, TROW benefits from a large interest for its target-date fund. As retirement planning is taking importance, TROW offers a mutual fund that modifies its asset allocation going toward a target date. In other words, the fund adapts automatically its strategy to stay in line with the client’s age.
Earnings

Source: Ycharts
TROW success comes from a long history of performance and partnerships with third parties. Since 2009, TROW surfed on the strongest tailwind any asset managers can hope for: a never-ending bullish market.
Since TROW makes money based on how much money it manages (AUM), an ever-growing market naturally pushes revenue and earnings higher year after year. By building a strong brand through its financial intermediaries and institutional clients, TROW has one of the stickiest investing brand products around. After all, which institutions would drop highly performing asset managers? You don’t trow history in the trash can that easily.
Dividend Growth Perspective
What I like about TROW is that it is not its first bull ride. The company has successfully gone through many cycles and maintained its dividend increase streak alive. Today, TROW shows 31 consecutive years with a dividend raise. This makes it part of the elite Dividend Aristocrats and Dividend Achievers list. The Dividend Achievers Index refers to all public companies that have successfully increased their dividend payments for at least ten consecutive years. At the time of writing this article, there were 265 companies that achieved this milestone. You can get the complete list of Dividend Achievers with comprehensive metrics here.
Source: Ycharts
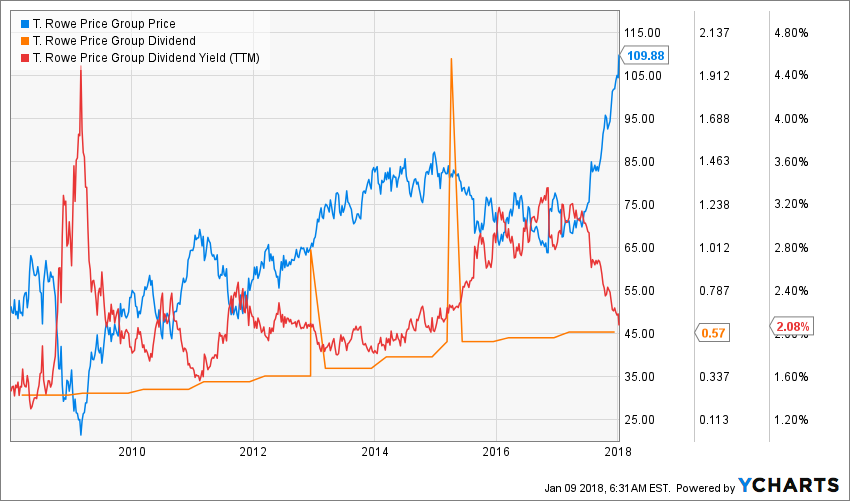
While the stock stagnated prior to 2017, we can see that T. Rowe kept increasing its dividend which pushed its yield to 3%. Now that the stock has surged, TROW offers a 2% dividend yield to investors. While this is not an astronomic distribution rate, TROW meets my 7 dividend growth investing principles.
Source: Ycharts
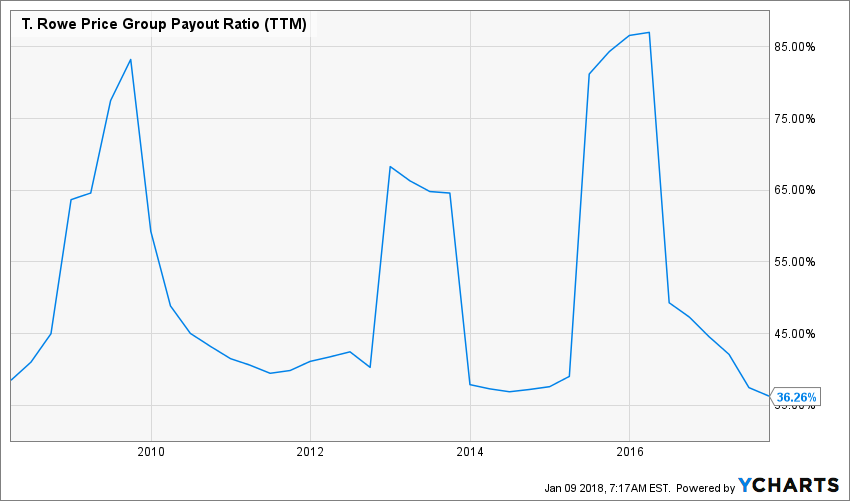
TROW has been an example among dividend payers for the past 30 years. Over the past 5 years, TROW has increased its dividend by 50% or 8.45% CAGR. Besides the special dividend paid, TROW has maintained a low payout ratio. There is no doubt the company will push its dividend increase streak to 32 this year.
Potential Downsides
One must remain cautious when looking at TROW numbers. While the company has gone through other market crashes, it doesn’t mean TROW won’t suffer during the next one. As the market goes up year after year, this pushes AUM higher. Then, revenues and earnings are rising naturally without any efforts. For example, TROW Q3 AUM increased by $44.3 billion. Out of this number, only $5.9 billion were net cash inflows. This means that as soon as the market enters in correction mode, the AUM will follow accordingly. As about 80% of TROW revenue comes from management fees, there will be an immediate effect on the stock price. Keep in mind the stock surged by 40% in 2017.
The company also started to reduce fees charged on some mutual funds. While this type of investment vehicle is still popular, the major trend is toward ETF investing. In order to remain competitive, TROW has no other choices but to modify its fee structure. This could hurt its profitability.
Valuation
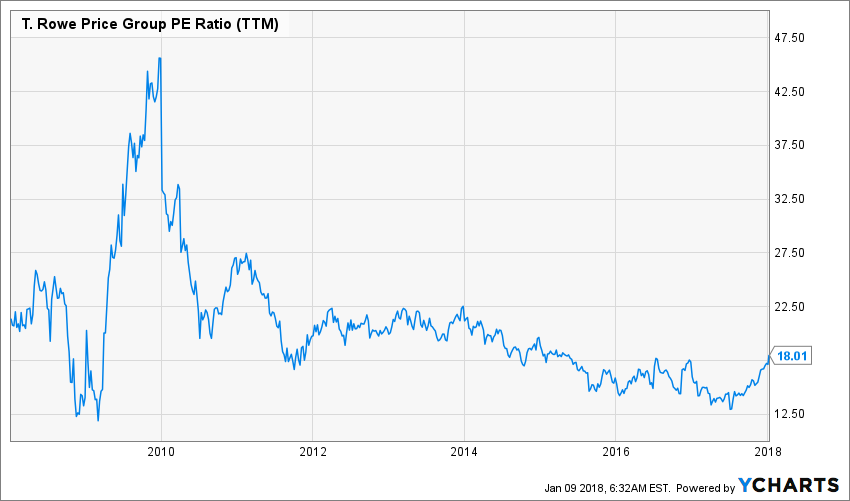
I was quite curious about TROW’s latest run on the market. When I looked at its PE history, I noticed the market simply brought back its previous multiple:
Source: Ycharts
I guess the market shares the same fear as I do when I think of TROW. While the company is very strong right now, the bulk of its business model is not geared toward ETF investing. The mutual fund industry is slowly dying, this is not a secret for anybody. However, TROW has successfully found a way out of this issue with target-fund and strong performances.
In order to have a better idea, I’ve used a double-stage dividend discount model. I used a 8% dividend growth rate for the first 10 years and reduced it to 6% afterward.
| Input Descriptions for 15-Cell Matrix | INPUTS | |||
| Enter Recent Annual Dividend Payment: | $2.28 | |||
| Enter Expected Dividend Growth Rate Years 1-10: | 8.00% | |||
| Enter Expected Terminal Dividend Growth Rate: | 6.00% | |||
| Enter Discount Rate: | 9.00% | |||
| Discount Rate (Horizontal) | ||||
| Margin of Safety | 8.00% | 9.00% | 10.00% | |
| 20% Premium | $172.37 | $114.18 | $85.12 | |
| 10% Premium | $158.00 | $104.66 | $78.02 | |
| Intrinsic Value | $143.64 | $95.15 | $70.93 | |
| 10% Discount | $129.28 | $85.63 | $63.84 | |
| 20% Discount | $114.91 | $76.12 | $56.74 | |
Please read the Dividend Discount Model limitations to fully understand my calculations.
I’m now surprised to see TROW being overvalued right now. At the same time, I hardly see how I could give TROW a strong dividend growth rate. As for the discount rate, I never go under 9%. As I often say, there is a price to pay for quality.
Final Thought
While TROW shows some real strengths and good numbers, I’ll have to pass on this one. I don’t think TROW will continue to do that well in the upcoming years. Its business model is still heavily geared toward fees charged on mutual funds. The current bull market shows everybody under their best day. I think TROW’s star will pale upon the next market correction.
Disclaimer: I do not hold TROW in my DividendStocksRock portfolios.This article was written by Dividend Monk. If you enjoyed this article, please subscribe to my feed [RSS]


