


Boosted by a new confidence, the market has hit new record highs lately. Value investors must be grinning at the moment as it was already difficult to find undervalued companies at the moment, a new boost in the stock market is nothing to help. Assessing the right value of a company is quite a challenge by itself, it’s even harder when you have several years of bullish markets to improve any metrics you look at. This is why I decided to revisit the methodology used in my dividend discount model calculations.
The basics of the dividend discount model
The idea behind the dividend discount model (DDM) is fairly simple; this model considers any company as a money making machine (e.g. dividend paying). The purpose of the calculations is to give a value of all future dividend payments that will be made by this company in the future.
This assumes the company will pay & increase dividends forever. This assumption is very important as you have to keep in mind that a very limited number of companies have been successfully increasing their dividend payment for 25 consecutive years. Those companies are called “dividend aristocrats”. There are 50 of them. A more elite group of companies exists where we consider only companies showing 50 consecutive years with a dividend increase. This small group of 18 companies are called the “dividend kings”. You can then imagine how you must remain cautious when you use a dividend growth rate as only 50 companies out of the S&P 500 had successfully increased their payouts long enough to be considered “an eternity of dividend payments”.
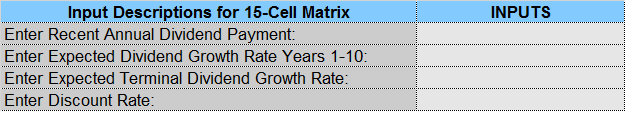
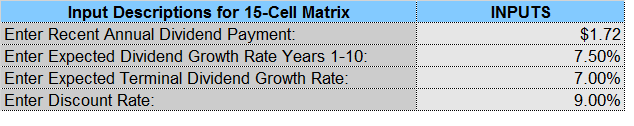
The tool I use to run my calculations is called the Dividend Toolkit. The toolkit comes with a 200 page book explaining how to find and assess strong dividend growth payers. This also comes with an excel spreadsheet doing all the hard work for you in order for you to avoid any miscalculation. The spreadsheet allows you to simply key-in the important numbers and it will run the dividend discount model for you without further error. There are two different dividend discount model spreadsheets. My favorite one is the double stage DDM. In this article, I will walk you through step-by-step in order to have the most precise valuation possible. There are four components in this spreadsheet:
Recent Annual Dividend Payment
Expected Dividend Growth Rate Years 1-10
Expected Terminal Dividend Growth Rate
Discount Rate
They are displayed as follows:
 For the purpose of this example, we will take McCormick (MKC) figures as at July 2016. The idea is not to make MKC stock analysis but rather to take real numbers to show you how they work out in the dividend discount model. As the recent annual dividend payment is quite easy to find. MKC recently increased its payout to $0.43/share quarterly. We already have our first data to enter in the matrix:
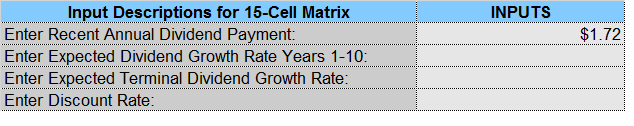 Now, let’s focus on the dividend growth rate…
Dividend Growth Rate Years 1-10
The first dividend growth rate to enter in the DDM is your assumption of what is going to happen over the next 10 years. This number can be more optimistic as it will only affect a period of time for the calculation. Plus, it has a better chance to reflect the near future of a company. There are many ways you can determine this number. You can use the past 10 years dividend growth history, the past 5 years, 3 years or the most recent year. You can also use other metrics to enhance your analysis.
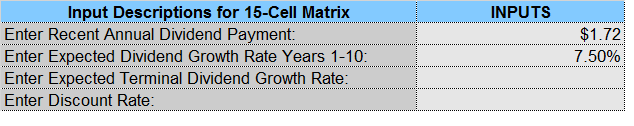
For example, MKC past 5 years dividend growth rate is at 9%. However, their most recent dividend increase was only of 7.5%. At the same time, the 5 years revenue growth was 5.18% and the 5 year EPS growth was 2.02%. Both recent revenue and EPS growth shows a 9% annual increase is unsustainable. Management seems to go towards the same assumptions as they raised their dividend by 7.5% in 2016. However, I can presume a sustainable dividend increase by looking at the payout (48.91%) and the cash payout (44.39%) ratios. Finally, MKC is spending 50% of its cash flow on business growth (introduction of new products, acquisitions and marketing). This means to me that MKC focuses on generating more revenues and eventually more cash flow for its shareholders. For this reason, I’ve selected a 7.50% dividend growth rate for the upcoming 10 years.
Here’s our second data to enter in our spreadsheet:
 The terminal dividend growth rate is a little bit tricky though…
Terminal Dividend Growth Rate
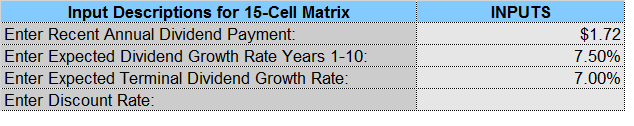
The terminal rate is the one to be used “forever”. Already, the word “forever” is big enough, we now have to quantify it. A mistake in your assumption at this stage will render your calculations bogus. In this situation, it is important to give more thought about the company business model, its past history of dividend payments along with what is coming in the future. In other words, you can’t determine a stock valuation without doing its detailed analysis first. In order to save you some time, I’ve already done the McCormick stock analysis on Seeking Alpha . In the light of my analysis, I’ve determined that a 7% dividend growth rate was possible. I always tend to diminish the terminal dividend growth rate vs its first 10 years in order to be more conservative. Here’s what we have so far in our spreadsheet:
 We are almost done (already!?!) before we get our valuation! All we need now is a discount rate.
Discount Rate
The discount rate reflects the risk vs return you expect from your investment. For example, if we had done the same analysis with treasury bills, the discount rate will have to be very small as it is a “risk free” return. When it comes down to investing in stocks, I use 4 differents discount rate.
9%: for companies with strong economic moat and stellar dividend growth history
10%: for companies with an economic advantage and a strong dividend growth history
11%: for companies showing additional risks (a weakness in their business model)
12%: for long shots
I don’t bother going too high or too low with the choice of my discount rate as it would not serve me well in the valuation process. For MKC, I will use a 9% discount rate based on the fact that MKC is a leader in its market, protects its model by investing massively in marketing and R&D and shows an impressive dividend payment record. In other words, this company shows less risks than Chevron (CVX) for example. We have then completed our spreadsheet:
 Now… let’s see how much MKC worth if it was purely a dividend paying machine. But first, we must introduce one last concept. The margin of safety.
The Margin of Safety
As you probably realized by now, making these assumptions puts you right between science and magic when it comes down to determining the future of a company. As a small difference in your calculation would lead to completely different valuation, it is important to have a margin of safety. This margin is the room for error in your calculations. The Dividend Toolkit will not only give you the intrinsic value of the company you analyze based on your numbers, but it will also calculate various scenarios where the margin of safety goes from a 20% discount to a 20% premium. Here’s a complete example to show you how it works.
15 Possible Values with the Dividend Discount Model
We are now at the final stage of our calculations. Once you finish your input, you automatically see the result on the right side of the spreadsheet:
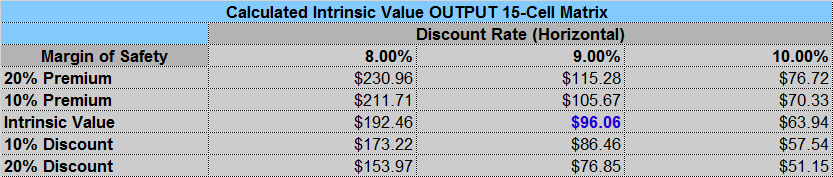 As you can see, the intrinsic value of MKC is $96.06. However, the Dividend Toolkit Spreadsheet also gives you the value if you had chose an 8% or a 10% discount rate. You also have various scenarios for its margin of safety. For example, if the stock would trade at $75 this morning and you have an intrinsic value of $96, you have a 20% discount value or 20% margin of safety. This means that you can buy the stock at $75 and even if you are wrong in your calculations, you still have 20% on the stock price as a margin of error. On the other hand, if the stock currently trades at $115, you know you are already paying an important premium. In other words, you have no room for error at this point.
As you can see, assigning a dollar value to a company is not that easy. You can get the Dividend Toolkit to help you in your investing process. Using this tool will enhance your investment process and give you a better indication as to when to buy the companies on your watch list and when to wait for a market correction.
This article was written by Dividend Monk. If you enjoyed this article, please subscribe to my feed [RSS]


