


Companies with a very short payback are often troubled or have been highly discounted due to the market’s lack of faith in them. At the other extreme, do you really want to wait 30, 40 or 50 years to earn back your initial investment?
As a compromise, a 9 to 13 year payback should be acceptable for most long-term investors. Once you earn back your investment, some might say you are in a no-lose situation. I wouldn’t go quite that far, but you have found an investment that that has provided you a good historical revenue stream, and hopefully it will continue to do so in the future.
Attached you can find 7 dividend growth stocks with a 9 to 13 year payback (at the current yield and dividend growth rate) and a yield between 2.5% to 6.0%.
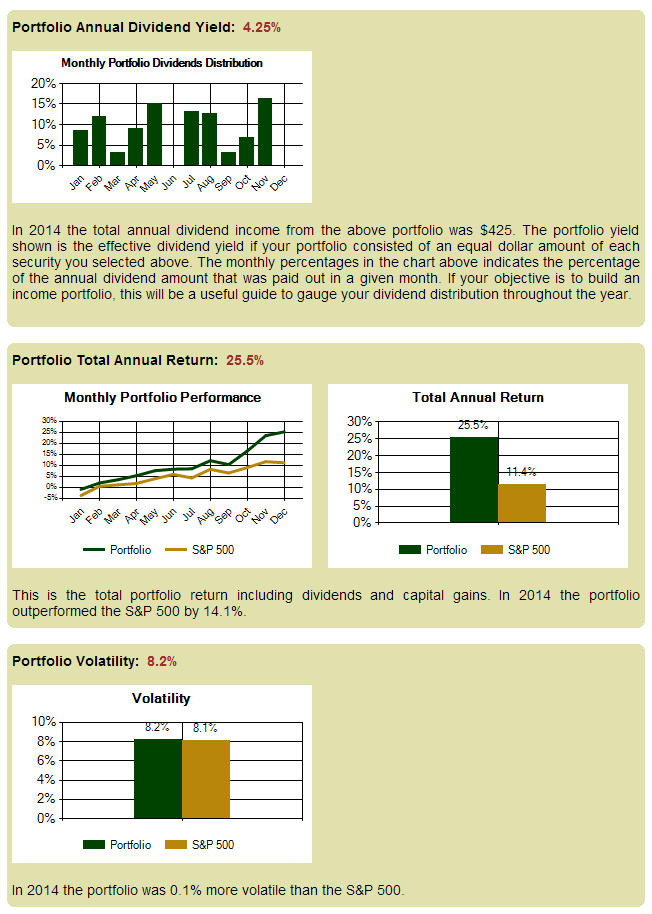
A combined portfolio delivered a total return of 25% in 2014. At the end of the article, you can find more about this fact.
Here are the results....
Omega Healthcare -- Yield: 6.19%
Omega Healthcare (NYSE:OHI) employs 27 people, generates revenue of $504.79 million and has a net income of $221.35 million. The current market capitalization stands at $6.66 billion.Omega Healthcare’s earnings before interest, taxes, depreciation and amortization (EBITDA) amounts to $476.18 million. The EBITDA margin is 94.33% (the operating margin is 68.41% and the net profit margin 43.85%).
Financials: The total debt represents 60.65% of Omega Healthcare assets and the total debt in relation to the equity amounts to 169.73%. Due to the financial situation, a return on equity of 16.39% was realized by Omega Healthcare.
Twelve trailing months earnings per share reached a value of $1.46. Last fiscal year, Omega Healthcare paid $2.02 in the form of dividends to shareholders.
Market Valuation: Here are the price ratios of the company: The P/E ratio is 24.62, the P/S ratio is 13.26 and the P/B ratio is finally 3.30. The dividend yield amounts to 6.19%.
Stock Charts:
") |
| Long-Term Stock Price Chart of Omega Healthcare (OHI) |
") |
| Long-Term Dividend Payment History of Omega Healthcare (OHI) |
") |
| Long-Term Dividend Yield History of Omega Healthcare (OHI) |
HCP -- Yield: 5.87%
HCP (NYSE:HCP) employs 170 people, generates revenue of $2,266.28 million and has a net income of $893.19 million. The current market capitalization stands at $17.75 billion.HCP’s earnings before interest, taxes, depreciation and amortization (EBITDA) amounts to $1,799.50 million. The EBITDA margin is 79.40% (the operating margin is 58.35% and the net profit margin 39.41%).
Financials: The total debt represents 45.67% of HCP assets and the total debt in relation to the equity amounts to 90.91%. Due to the financial situation, a return on equity of 8.31% was realized by HCP.
Twelve trailing months earnings per share reached a value of $0.80. Last fiscal year, HCP paid $2.18 in the form of dividends to shareholders.
Market Valuation: Here are the price ratios of the company: The P/E ratio is 48.27, the P/S ratio is 7.86 and the P/B ratio is finally 1.65. The dividend yield amounts to 5.87%.
Stock Charts:
") |
| Long-Term Stock Price Chart of HCP (HCP) |
") |
| Long-Term Dividend Payment History of HCP (HCP) |
") |
| Long-Term Dividend Yield History of HCP (HCP) |
Cracker Barrel Old Country Store -- Yield: 3.12%
Cracker Barrel Old Country Store (NASDAQ:CBRL) employs 72,000 people, generates revenue of $2,842.28 million and has a net income of $163.90 million. The current market capitalization stands at $3.39 billion.Cracker Barrel Old Country Store’s earnings before interest, taxes, depreciation and amortization (EBITDA) amounts to $327.27 million. The EBITDA margin is 11.51% (the operating margin is 8.97% and the net profit margin 5.77%).
Financials: The total debt represents 25.38% of Cracker Barrel Old Country Store assets and the total debt in relation to the equity amounts to 74.31%. Due to the financial situation, a return on equity of 30.72% was realized by Cracker Barrel Old Country Store.
Twelve trailing months earnings per share reached a value of $6.81. Last fiscal year, Cracker Barrel Old Country Store paid $4.10 in the form of dividends to shareholders.
Market Valuation: Here are the price ratios of the company: The P/E ratio is 21.00, the P/S ratio is 1.19 and the P/B ratio is finally 6.28. The dividend yield amounts to 3.12%.
Stock Charts:
") |
| Long-Term Stock Price Chart of Cracker Barrel Old Country Store (CBRL) |
") |
| Long-Term Dividend Payment History of Cracker Barrel Old Country Store (CBRL) |
") |
| Long-Term Dividend Yield History of Cracker Barrel Old Country Store (CBRL) |
Target Corporation -- Yield: 3.00%
Target Corporation (NYSE:TGT) employs 347,000 people, generates revenue of $72,618.00 million and has a net income of $2,449.00 million. The current market capitalization stands at $47.14 billion.Target Corporation’s earnings before interest, taxes, depreciation and amortization (EBITDA) amounts to $6,665.00 million. The EBITDA margin is 9.18% (the operating margin is 6.25% and the net profit margin 3.37%).
Financials: The total debt represents 30.91% of Target Corporation assets and the total debt in relation to the equity amounts to 91.42%. Due to the financial situation, a return on equity of 16.20% was realized by Target Corporation.
Twelve trailing months earnings per share reached a value of $4.52. Last fiscal year, Target Corporation paid $1.99 in the form of dividends to shareholders.
Market Valuation: Here are the price ratios of the company: The P/E ratio is 16.85, the P/S ratio is 0.65 and the P/B ratio is finally 3.42. The dividend yield amounts to 3.00%.
Stock Charts:
") |
| Long-Term Stock Price Chart of Target Corporation (TGT) |
") |
| Long-Term Dividend Payment History of Target Corporation (TGT) |
") |
| Long-Term Dividend Yield History of Target Corporation (TGT) |
Lockheed Martin -- Yield: 2.96%
Lockheed Martin (NYSE:LMT) employs 112,000 people, generates revenue of $45,600.00 million and has a net income of $3,614.00 million. The current market capitalization stands at $68.03 billion.Lockheed Martin’s earnings before interest, taxes, depreciation and amortization (EBITDA) amounts to $7,047.00 million. The EBITDA margin is 15.45% (the operating margin is 12.26% and the net profit margin 7.93%).
Financials: The total debt represents 16.64% of Lockheed Martin assets and the total debt in relation to the equity amounts to 181.44%. Due to the financial situation, a return on equity of 86.90% was realized by Lockheed Martin.
Twelve trailing months earnings per share reached a value of $11.27. Last fiscal year, Lockheed Martin paid $5.49 in the form of dividends to shareholders.
Market Valuation: Here are the price ratios of the company: The P/E ratio is 19.54, the P/S ratio is 1.50 and the P/B ratio is finally 20.60. The dividend yield amounts to 2.96%.
Stock Charts:
") |
| Long-Term Stock Price Chart of Lockheed Martin (LMT) |
") |
| Long-Term Dividend Payment History of Lockheed Martin (LMT) |
") |
| Long-Term Dividend Yield History of Lockheed Martin (LMT) |
Cisco Systems -- Yield: 2.89%
Cisco Systems (NASDAQ:CSCO) employs 71,833 people, generates revenue of $49,161.00 million and has a net income of $8,981.00 million. The current market capitalization stands at $147.75 billion.Cisco Systems’s earnings before interest, taxes, depreciation and amortization (EBITDA) amounts to $13,696.00 million. The EBITDA margin is 27.86% (the operating margin is 21.91% and the net profit margin 18.27%).
Financials: The total debt represents 22.34% of Cisco Systems assets and the total debt in relation to the equity amounts to 42.47%. Due to the financial situation, a return on equity of 15.44% was realized by Cisco Systems.
Twelve trailing months earnings per share reached a value of $1.75. Last fiscal year, Cisco Systems paid $0.80 in the form of dividends to shareholders.
Market Valuation: Here are the price ratios of the company: The P/E ratio is 16.83, the P/S ratio is 3.01 and the P/B ratio is finally 2.47. The dividend yield amounts to 2.89%.
Stock Charts:
") |
| Long-Term Stock Price Chart of Cisco Systems (CSCO) |
") |
| Long-Term Dividend Payment History of Cisco Systems (CSCO) |
") |
| Long-Term Dividend Yield History of Cisco Systems (CSCO) |
Microsoft -- Yield: 2.68%
Microsoft (NASDAQ:MSFT) employs 118,000 people, generates revenue of $93,580.00 million and has a net income of $12,193.00 million. The current market capitalization stands at $430.37 billion.Microsoft’s earnings before interest, taxes, depreciation and amortization (EBITDA) amounts to $34,129.00 million. The EBITDA margin is 36.47% (the operating margin is 19.21% and the net profit margin 13.03%).
Financials: The total debt represents 20.03% of Microsoft assets and the total debt in relation to the equity amounts to 44.07%. Due to the financial situation, a return on equity of 14.36% was realized by Microsoft.
Twelve trailing months earnings per share reached a value of $1.49. Last fiscal year, Microsoft paid $1.24 in the form of dividends to shareholders.
Market Valuation: Here are the price ratios of the company: The P/E ratio is 35.75, the P/S ratio is 4.58 and the P/B ratio is finally 5.38. The dividend yield amounts to 2.68%.
Stock Charts:
") |
| Long-Term Stock Price Chart of Microsoft (MSFT) |
") |
| Long-Term Dividend Payment History of Microsoft (MSFT) |
") |
| Long-Term Dividend Yield History of Microsoft (MSFT) |
Here is how the stock selection performed over the past decade...

A 10,000 USD Investment Portfolio Generated 425 USD Dividend Income in 2014 and 2,500 USD Total Return...
This article was written by Dividend Yield. If you enjoyed this article, please subscribe to his feed [RSS].


