Recent Posts From DIV-Net Members

Diebold Stock Analysis

Diebold, Incorporated (DBD) provides integrated self-service delivery and security systems and services primarily to the financial, commercial, government, and retail markets worldwide. Diebold is a dividend champion which has paid uninterrupted dividends on its common stock since 1954 and increased payments to common shareholders every year for 58 years. There are only ten companies which have raised dividends for over half a century. Diebold is the only company in the world which has managed to raise dividends for 58 years in a row.

The most recent dividend increase was in February 2011, when the Board of Directors approved a 3.70% increase in the quarterly dividend to 28 cents/share. Diebold’s largest competitors include NCR Corp (NCR), AVID Technology (AVID) and Stratasys (SSYS).


Over the past decade this dividend growth stock has delivered an annualized total return of 0% to its shareholders. Just like most other stocks, Diebold was overvalued at the beginning of the decade, which led to poor total returns.


Analysts expect Diebold to earn $2.08 per share in 2011 and $2.31 per share in 2012. In comparison Diebold lost $0.31 /share in 2010. The company has managed to consistently repurchase 1.30% of its common stock outstanding over the past decade through share buybacks.


The earnings pattern over the past decade has been volatile while lacking any upward trend. Even if analyst’s estimates materialize for 2011 and 2012, the company’s EPS would still be below the 2004 highs of $2.54/share. If Diebold is unable to deliver a sustainable earnings growth over the next decade, it would be unable to continue increasing distributions to its shareholders.

The company’s Returns on Equty have closely followed the deterioration of earnings over the past decade. If the company manages to increase earnings per share past $2, ROE should increase comfortably in the mid to high teen percentage. Rather than focus on absolute values for this indicator, I generally want to see at least a stable return on equity over time.


The annual dividend payment has increased by 6% per year over the past decade, which is higher than the growth in EPS.

A 6% growth in distributions translates into the dividend payment doubling every twelve years. If we look at historical data, going as far back as 1961, we see that Diebold has actually managed to double its dividend every seven years on average.

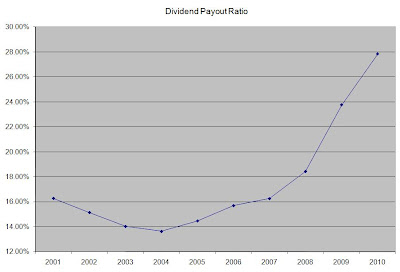
The dividend payout ratio has remained below 50% in only 3 of the past ten years. Based on forward earnings for 2011 however, the payout ratio is close to 50%. A lower payout is always a plus, since it leaves room for consistent dividend growth minimizing the impact of short-term fluctuations in earnings.

Currently Diebold is trading at 13.90 times 2011 earnings, yields 3.90% and has a sustainable forward dividend payout. The erratic earnings picture over the past decade however makes this stock a hold. If the company's management doesn't manage to increase earnings over the next decade, the company's streak of consecutive dividend increases will have to come to an end.

Full Disclosure: None

Relevant Articles:


This article was written by Dividend Growth Investor. If you enjoyed this article, please subscribe to my feed [RSS], or have future articles emailed to you [Email] or follow me on Twitter [Twitter].


Continue Reading »

Three Telecoms

Telecoms can be a wonderful dividend growth investment. As always, I like to invest in companies that produce products that people need. I can think of few things people need more than communication with one another. Even in recessions and time of distress, people still use their cell phones and home telephones to communicate with one another. In fact, it could be argued that people use them more in times of trouble...as people want to stay in touch and make sure family and friends are alright. Many things can be trimmed from an average household budget, but a telephone is likely one of the last things to go. Even if you're unemployed you still need to call potential employers for job openings and you need a way for them to contact you and talk to you.

Of course, the telecommunications industry is not without its drawbacks. Items to consider are relatively high debt due to the need to deploy high amounts of capital to fund new networks and infrastructure. There isn't a lot of room for a high amount of future growth in this industry, especially here in the U.S. I would argue that the players are already out on the field, and there is a fixed amount of population growth here in this country. There is limited potential for high growth as most people already own home phones or cell phones. The potential for growth will likely be less in increasing subscribers and may more likely come from increased sales of costly contracts including data usage for smart phones. Because of this, I'm including only one domestic play and two international stocks so you can have the familiar domestic exposure and the potential growth with international exposure.

Three telecoms that look like solid long-term bets are:

AT&T Inc. (T)

I've written about AT&T many times. I don't own any stock yet, but it's very high on my watch list. It offers an outstanding entry yield at 6%, and has dividend growth as well with 27 years of growing its dividend. Although the dividend growth is slow, with the last raise being just over 2%, you're starting with a pretty high yield which provides current income and fuel for other investments if necessary. I think it's good to have a mix of stocks that provide high entry yield to fuel the portfolio at the beginning, and then have stocks that may have a lower entry yield but higher growth to provide long-term growth. T is a little rocket fuel for a young portfolio, or someone who's older and looking for current income. It also has a fairly low debt/equity ratio of 0.5.

Telefonica S.A. (TEF)

Telefonica trades as an ADR on the NYSE. There are some important factors to consider here. First, it's a foreign company, with headquarters in Madrid, Spain. Because of this you'll have a 19% withholding tax from Spain, and you'll also likely have very small ADR fees passed on to you from some of the major ADR banks. Always do your own diligence. For all this trouble, you'll be getting an entry yield of just over 10%, with a pretty decent dividend growth history behind it. TEF has grown its dividend for 8 years, and has plans to grow it for at least the next 2 years. The stock seems undervalued and depressed currently, fueled by concerns over the weakening Spanish market and the high debt load. Of these concerns, my bigger fear is the debt load TEF carries. It currently sports a high debt/equity ratio of 2.6. This is something to monitor. It's a value play with high debt and a high dividend, so you have to be careful with this one. This is the riskiest of the three, in my opinion.

Vodafone Group PLC (VOD)

Vodafone is currently the second largest wireless phone company in the world behind China Mobile. It has a low debt/equity ratio of 0.4 and a pretty high entry yield of 5.61%. Vodafone is a great way to get international exposure in the telecommunications sector. The nice thing is that although VOD trades as an ADR on the Nasdaq exchange, you won't pay foreign withholding taxes as a U.S. investor due to a tax treaty with the U.K. Vodafone is headquartered in Newbury, England. VOD does not have the dividend growth that the other two stocks listed do, so this would likely be a good complimentary holding to another telecom stock.

Full Disclosure: I'm long TEF.

Thanks for reading.

This article was written by Dividend Mantra. If you enjoyed this article, please consider subscribing to my feed.


Continue Reading »

Versant's Persistency

Versant trades for just $33 million, despite no debt and a cash balance of $23 million. With this kind of profile, one would expect to find a company losing a whole lot of money. But this is not the case: Versant has remained profitable every year throughout this downturn!


Continue Reading »

Consolidated Energy's High Yield

Energy companies are always attractive to investors for their dividend payouts. Utility companies are good at getting consistent cash flows because of the payments from utility customers. One of the largest utility companies in the country is offering up a solid dividend payout. That company is Consolidated Edison (ED).

Consolidated Edison is known for providing energy service to the residents of New York. The utility company also services parts of the New Jersey and Philadelphia area. The company has a long history of providing electric service to customers having been founded in 1823. Electric, gas, and steam are all industries in which the firm actively participates in.

Consolidated Edison generates the bulk of its revenue from its electric services. Consolidated Edison is a slow growth performer delivering growth below 1% over the past five years and future growth is pegged at just 2%. The firm has generated revenue of $13 billion dollars each of the past three years and creates over $3 billion dollars in cash flow.

The company currently trades at 4.5 times earnings growth and 15 times earnings. The company trades at 1.5 times book value and 1.2 times sales. The firm is heavily levered as most energy companies are with $10 billion in debt. The firm has no trouble servicing its debt due to the large amount of cash that it earns.

Consolidated Edison attracts a lot of income investors because of the stability of the company’s earnings and its dividend payout. The company has increased its dividend for 38 consecutive years. Consolidated Edison pays a dividend of $2.40 per share and has a yield of 4.2%. This yield is actually lower than the 5 year yield of 5.2%. The payout ratio of 67% is easily sustainable.

Consolidated Edison is a company that should be of interest to investors seeking dividend growth and a consistent cash payout.

If you enjoyed this article, please consider subscribing to my feed at [RSS].


Continue Reading »

Stock Analysis: Medtronic Inc. (MDT)

Linked here is a detailed quantitative analysis of Medtronic Inc. (MDT). Below are some highlights from the above linked analysis:

Company Description: Medtronic Inc.is a global medical device manufacturer with leadership positions in the pacemaker, defibrillator, orthopedic, diabetes management, and other medical markets.

Fair Value: In calculating fair value, I consider the NPV MMA Differential Fair Value along with these four calculations of fair value, see page 2 of the linked PDF for a detailed description:

1. Avg. High Yield Price
2. 20-Year DCF Price
3. Avg. P/E Price
4. Graham Number

MDT is trading at a discount to 1.) and 3.) above. The stock is trading at a slight discount to its calculated fair value of $34.63. MDT earned a Star in this section since it is trading at a fair value.

Dividend Analytical Data: In this section there are three possible Stars and three key metrics, see page 2 of the linked PDF for a detailed description:

1. Free Cash Flow Payout
2. Debt To Total Capital
3. Key Metrics
4. Dividend Growth Rate
5. Years of Div. Growth
6. Rolling 4-yr Div. > 15%

MDT earned two Stars in this section for 1.) and 2.) above. A Star was earned since the Free Cash Flow payout ratio was less than 60% and there were no negative Free Cash Flows over the last 10 years.

The stock earned a Star as a result of its most recent Debt to Total Capital being less than 45%. The company has paid a cash dividend to shareholders every year since 1977 and has increased its dividend payments for 34 consecutive years.

Dividend Income vs. MMA: Why would you assume the equity risk and invest in a dividend stock if you could earn a better return in a much less risky money market account (MMA) or Treasury bond? This section compares the earning ability of this stock with a high yield MMA. Two items are considered in this section, see page 2 of the linked PDF for a detailed description:

1. NPV MMA Diff.
2. Years to > MMA

MDT earned a Star in this section for its NPV MMA Diff. of the $624. This amount is in excess of the $500 target I look for in a stock that has increased dividends as long as MDT has. If MDT grows its dividend at 7.8% per year, it will take 6 years to equal a MMA yielding an estimated 20-year average rate of 4.1%.

Memberships and Peers: MDT is a member of the S&P 500 and a member of the Broad Dividend Achievers™ Index and a Dividend Champion. The company's peer group includes: The Becton, Dickinson and Company (BDX) with a 2.0% yield, Baxter International Inc. (BAX) with a 2.2% yield and CR Bard Inc. (BLK) with a 0.8% yield.

Conclusion: MDT earned one Star in the Fair Value section, earned two Stars in the Dividend Analytical Data section and earned one Star in the Dividend Income vs. MMA section for a total of four Stars. This quantitatively ranks MDT as a 4 Star-Strong stock.

Using my D4L-PreScreen.xls model, I determined the share price would need to increase to $35.36 before MDT's NPV MMA Differential decreased to the $500 minimum that I look for in a stock with 34 years of consecutive dividend increases. At that price the stock would yield 2.7%.

Resetting the D4L-PreScreen.xls model and solving for the dividend growth rate needed to generate the target $500 NPV MMA Differential, the calculated rate is 7.2%. This dividend growth rate is below the 7.8% used in this analysis, thus providing a slight margin of safety. MDT has a risk rating of 1.00 which classifies it as a Low risk stock.

MDT owns a diversified portfolio with a strategy to develop products for a wide range of chronic diseases. Although it is exposed to the highly competitive areas of the medical equipment markets, MDT enjoys many competitive advantages including scale (operations and sales), product breadth and financial strength. I will continue to buy in moderation when the stock trad below my calculated fair value of $34.63 and as my allocation allows.

Disclaimer: Material presented here is for informational purposes only. The above quantitative stock analysis, including the Star rating, is mechanically calculated and is based on historical information. The analysis assumes the stock will perform in the future as it has in the past. This is generally never true. Before buying or selling any stock you should do your own research and reach your own conclusion. See my Disclaimer for more information.

Full Disclosure: At the time of this writing, I was long in MDT (3.5% of my Dividend Growth Portfolio). See a list of all my dividend growth holdings here.

Related Articles:
- Lowe's Companies, Inc. (LOW) Dividend Stock Analysis
- United Technologies Corp. (UTX) Dividend Stock Analysis
- Harleysville Group Inc. (HGIC) Dividend Stock Analysis
- Illinois Tool Works Inc. (ITW) Dividend Stock Analysis
- More Stock Analysis

This article was written by Dividends4Life. If you enjoyed this article, please subscribe to my feed [RSS], or have future articles emailed to you [Email] or follow me on Twitter [Twitter].


Continue Reading »

Weekend Reading Links - September 25, 2011

For your weekend reading pleasure, the articles listed below contain some of the best dividend and value investing insights found on the web. They were written by various members of the Dividend Investing and Value Network over the past week:

Articles From DIV-Net Members

There are some really good articles here, please take time and read a few of them.


Continue Reading »

Eaton Vance Stock Analysis

Eaton Vance Corp. (EV), through its subsidiaries, engages in the creation, marketing, and management of investment funds in the United States. It also provides investment management and counseling services to institutions and individuals. Eaton Vance is a dividend champion which has paid uninterrupted dividends on its common stock since 1976 and increased payments to common shareholders every year for 30 years.

The most recent dividend increase was in October 2010, when the Board of Directors approved a 12.50% increase in the quarterly dividend to 18 cents/share. Eaton Vance’s largest competitors include Franklin Resources (BEN), T. Rowe Price Group (TROW) and Blackrock (BLK). In a previous article I mentioned that I am bullish on asset managers for the long run, and Eaton Vance fits by default.


Over the past decade this dividend growth stock has delivered an annualized total return of 5.30% to its shareholders.

The company has managed to deliver a 6.60% annual increase in EPS since 2001. Analysts expect Eaton Vance to earn $1.82 per share in 2011 and $1.99 per share in 2012. In comparison Eaton Wance earned $1.42 /share in 2010. The company has managed to consistently repurchase 2.25% of its common stock outstanding over the past decade through share buybacks.


The company generates a very high return on equity, which has followed the ups and downs of the stock market over the past decade. Rather than focus on absolute values for this indicator, I generally want to see at least a stable return on equity over time.

The annual dividend payment has increased by 19.80% per year over the past decade, which is higher than the growth in EPS.

A 20% growth in distributions translates into the dividend payment doubling almost every three and a half years. If we look at historical data, going as far back as 1990, we see that Eaton Vance has actually managed to double its dividend every four years on average.

The dividend payout ratio has almost tripled from 17% in 2001 to 47% in 2010. The reason behind this increase was the fact that dividend growth exceeded earnings growth over the past decade. Based on forward earnings for 2011 however, the payout ratio is less than 40%. A lower payout is always a plus, since it leaves room for consistent dividend growth minimizing the impact of short-term fluctuations in earnings.

Currently Eaton Vance is trading at 12.70 times earnings, yields 3.20% and has a sustainable dividend payout. The company rarely yields more than 2.50%, is attractively valued per my entry criteria, which is why I view the current weakness in the stock price as a good opportunity to add to my position.

Full Disclosure: Long EV

Relevant Articles:


This article was written by Dividend Growth Investor. If you enjoyed this article, please subscribe to my feed [RSS], or have future articles emailed to you [Email] or follow me on Twitter [Twitter].


Continue Reading »

10-Year Treasury Yield? Double It!

The 10-year Treasury is yielding 1.85% as of this writing. I currently have no exposure to bonds in my portfolio. This anemic yield is one of those reasons. Why would I want to lock in my capital for such a low yield, especially for a period as long as 10 years? Treasuries are, of course, extremely liquid and can be sold virtually at any time. Of course, if yields rise the value of your bonds go down. In that case, you'll be accepting a very low yield and also have a investment vehicle that will be losing value when the yields finally rise. No, thanks.

Let's instead look at three stocks that are currently yielding at least twice the benchmark 10-year Treasury. These stocks not only have double the yield payout as the 10-year, but also have a good chance for price appreciation as these businesses produce products that people need and will continue to buy. Double the yield and the chance of capital gains on top of it sounds pretty good to me.

Let's take a look:

AT&T Inc. (T)

This major U.S. telecommunications company is currently yielding 6%. This stock actually yields over triple the benchmark 10-year. I've written about T a few times in the recent past. I would agree that T faces a pretty mature U.S. market, and probably doesn't have a lot of room for blockbuster growth. I do think as people become more attached to their smart phones and data usage, these devices become as much a part of life as a house and a car does. It's currently priced at a P/E ratio of under 9.

Raytheon Company (RTN)

This defense company isn't the largest on the block, but it produces a pretty unique lineup of products. It currently yields 4.3%, which is over double the benchmark 10-year. It's also trading at a pretty low P/E ratio of 7.43. I believe it's priced so low because a lot of investors are fearful of a precipitous drop in defense spending. While this will certainly have an impact on Raytheon's earnings, I don't believe war is going away anytime soon. Throughout human civilization there has always been a need for defense/war products. I don't believe this need will abate anytime soon.

ConocoPhillips (COP)

The international integrated oil company is currently yielding just over 4%, which is just north of twice the 10-year Treasury. Oil is a product that is only increasing in demand as developing countries are increasing their use of vehicles and power. Oil is also a natural resource that has a finite supply here on Earth, and we all know the rules of supply and demand. It has a P/E ratio of 8.18, which I feel is pretty attractive.

What do you think? Is double the yield attractive right now?


Full Disclosure: I'm long COP.

Thanks for reading.

This article was written by Dividend Mantra. If you enjoyed this article, please consider subscribing to my feed.


Continue Reading »

Take The Hint

In the current climate, there is no shortage of potential value investments. Unfortunately, certain managements are eroding that value, rather than passing it on to shareholders. Recent examples of that appear to be taking place here and here.

At the same time, there are other potential value plays where it's a little less clear as to whether value will be eroded or whether it will eventually accrue to shareholders. In these companies, management may be doing a little bit in order to appease shareholders, but could be doing a heck of a lot more. Examples of this type of company are discussed here and here.

Finally, there are the value plays where management doesn't just talk a big game...they deliver. These managements have a history of making great capital allocation decisions, resulting in a business with strong returns on capital, and a record of returning cash to shareholders when investment opportunities aren't there. Usually, such companies trade at expensive prices, but in an environment such as this one, where fear rules the day, stocks in such companies are available at very attractive prices.


Continue Reading »

Texas Instruments Raises Its Dividend

Texas Instruments (TXN) is one of the most overlooked chipmakers in the industry. People have heard of the company because of its calculators but know very little about the chipmaking abilities of the company. Texas Instruments actually derives the bulk of its revenue from chips. While Intel gets much of the attention in the sector, Texas Instruments has been able to historically deliver solid results year after year with analog chips. The chipmaking industry is incredibly competitive and requires large amounts of capital to compete. That is because companies have to invest heavily in the latest technologies and has to fend off competitors. Texas Instruments has struggled in the industry over the past year with growth declining and has decided to refocus on its core operations. The company is aiming to reinvest in its analog chip business.

The biggest asset that Texas Instruments has is its balance sheet. The company has more than $6 billion in cash and just $3 billion dollars in debt. The company is cash rich with over $5.50 a share in cash. Texas Instruments generates $2.6 billion in free cash flow and $3.8 billion dollars from operations. That is what makes the stock attractive to investors looking for safety.

Texas Instruments currently trades at 2.9 times book value and 2.3 times sales. The stock trades at 10.5 times earnings which is high considering the negative growth rate over the past year. The forward P/E of 11.5 is based on a projected future growth rate of 10.5%. Return on equity and operating margins are high at over 30%.

The company is starting to become a more attractive dividend play as the payout and yield have been increasing. Texas Instruments recently boosted its dividend 31% up to 68 cent per share on an annual basis. The stock is currently yielding 2.45%. That is not yet in the area of a high yielder but it is improving. Texas Instruments appears to be in interesting rebound play for investors that think the stock can turn things around.

This article was written by [Buy Like Buffett]. If you enjoyed this article, please consider subscribing to my feed at [RSS].


Continue Reading »

Stock Analysis: T. Rowe Price Group Inc. (TROW)

Linked here is a detailed quantitative analysis of T. Rowe Price Group Inc. (TROW). Below are some highlights from the above linked analysis:

Company Description: T. Rowe Price Group Inc. operates one of the largest no-load mutual fund complexes in the United States.

Fair Value: In calculating fair value, I consider the NPV MMA Differential Fair Value along with these four calculations of fair value, see page 2 of the linked PDF for a detailed description:

1. Avg. High Yield Price
2. 20-Year DCF Price
3. Avg. P/E Price
4. Graham Number

TROW is trading at a discount to only 3.) above. The stock is trading at a 21.3% premium to its calculated fair value of $44.1. TROW did not earn any Stars in this section.

Dividend Analytical Data: In this section there are three possible Stars and three key metrics, see page 2 of the linked PDF for a detailed description:

1. Free Cash Flow Payout
2. Debt To Total Capital
3. Key Metrics
4. Dividend Growth Rate
5. Years of Div. Growth
6. Rolling 4-yr Div. > 15%

TROW earned three Stars in this section for 1.), 2.) and 3.) above. A Star was earned since the Free Cash Flow payout ratio was less than 60% and there were no negative Free Cash Flows over the last 10 years. The stock earned a Star as a result of its most recent Debt to Total Capital being less than 45%. TROW earned a Star for having an acceptable score in at least two of the four Key Metrics measured.

Rolling 4-yr Div. > 15% means that dividends grew on average in excess of 15% for each consecutive 4 year period over the last 10 years (2001-2004, 2002-2005, 2003-2006, etc.) I consider this a key metric since dividends will double every 5 years if they grow by 15%. The company has paid a cash dividend to shareholders every year since 1986 and has increased its dividend payments for 24 consecutive years.

Dividend Income vs. MMA: Why would you assume the equity risk and invest in a dividend stock if you could earn a better return in a much less risky money market account (MMA) or Treasury bond? This section compares the earning ability of this stock with a high yield MMA. Two items are considered in this section, see page 2 of the linked PDF for a detailed description:

1. NPV MMA Diff.
2. Years to > MMA

TROW earned a Star in this section for its NPV MMA Diff. of the $3,239. This amount is in excess of the $1,100 target I look for in a stock that has increased dividends as long as TROW has. If TROW grows its dividend at 15.0% per year, it will take 5 years to equal a MMA yielding an estimated 20-year average rate of 4.1%.

Memberships and Peers: TROW is a member of the S&P 500 a member of the Broad Dividend Achievers™ Index. The company's peer group includes: The Federated Investors (FII) with a 5.8% yield, Eaton Vance (EV) with a 3.2% yield and BlackRock Inc. (BLK) with a 3.5% yield.

Conclusion: TROW did not earn any Stars in the Fair Value section, earned three Stars in the Dividend Analytical Data section and earned one Star in the Dividend Income vs. MMA section for a total of four Stars. This quantitatively ranks TROW as a 4 Star-Strong stock.

Using my D4L-PreScreen.xls model, I determined the share price would need to increase to $78.56 before TROW's NPV MMA Differential decreased to the $1,100 minimum that I look for in a stock with 24 years of consecutive dividend increases. At that price the stock would yield 1.6%.

Resetting the D4L-PreScreen.xls model and solving for the dividend growth rate needed to generate the target $1,100 NPV MMA Differential, the calculated rate is 11.5%. This dividend growth rate is well below the 15.0% used in this analysis, thus providing a margin of safety. TROW has a risk rating of 1.75 which classifies it as a Medium risk stock.

TROW is well-positioned as an asset manager with a strong market share and a well-respected brand. It consistently produces net client inflows based on the relative performance of its funds with over 70% of its funds in the top half of their categories on a five-year performance basis.

Given low short-term interest rates and the significant cash on the balance sheet, TROW was able to increase its share buyback in Q2/2011 to $210 million, from $31 million in the Q1/2011. The stock's current valuation is 21% above my calculated fair value of $44.10. I am watching this stock closely, but unwilling to buy at this premium and yield.

Disclaimer: Material presented here is for informational purposes only. The above quantitative stock analysis, including the Star rating, is mechanically calculated and is based on historical information. The analysis assumes the stock will perform in the future as it has in the past. This is generally never true. Before buying or selling any stock you should do your own research and reach your own conclusion. See my Disclaimer for more information.

Full Disclosure: At the time of this writing, I held no position in TROW (0.0% of my Dividend Growth Portfolio). See a list of all my dividend growth holdings here.

Related Articles:
- United Technologies Corp. (UTX) Dividend Stock Analysis
- Harleysville Group Inc. (HGIC) Dividend Stock Analysis
- Illinois Tool Works Inc. (ITW) Dividend Stock Analysis
- Chevron Corporation (CVX) Dividend Stock Analysis
- More Stock Analysis

This article was written by Dividends4Life. If you enjoyed this article, please subscribe to my feed [RSS], or have future articles emailed to you [Email] or follow me on Twitter [Twitter].


Continue Reading »

Weekend Reading Links - September 18, 2011

For your weekend reading pleasure, the articles listed below contain some of the best dividend and value investing insights found on the web. They were written by various members of the Dividend Investing and Value Network over the past week:

Articles From DIV-Net Members

There are some really good articles here, please take time and read a few of them.


Continue Reading »

Stock Analysis: Walgreen

Walgreen Co. (WAG), together with its subsidiaries, engages in the operation of a chain of drugstores in the United States. The company’s drugstores sell prescription and non-prescription drugs, and general merchandise. Walgreen is a dividend aristocrat which has paid uninterrupted dividends on its common stock since 1933 and increased payments to common shareholders every year for 36 years.

The most recent dividend increase was in July 2011, when the Board of Directors approved a 28.60% increase in the quarterly dividend to 22.50 cents/share. Walgreen’s largest competitors include Wal-Mart (WMT), CVS Caremark (CVS) and Rite-Aid (RAD).


Over the past decade this dividend growth stock has delivered an annualized total return of 1.40% to its shareholders.

The company has managed to deliver a 10.50% annual increase in EPS since 2001. Analysts expect Walgreens to earn $2.62 per share in 2011 and $2.99 per share in 2012. In comparison Intel earned $2.12 /share in 2010. The company has managed to consistently repurchase 0.50% of its common stock outstanding over the past decade through share buybacks.


The return on equity has decreased to 14.50% after reaching a high of 19% in 2007. Rather than focus on absolute values for this indicator, I generally want to see at least a stable return on equity over time.

The annual dividend payment has increased by 17.30% per year over the past decade, which is higher than the growth in EPS.

A 17% growth in distributions translates into the dividend payment doubling almost every 4 years. If we look at historical data, going as far back as 1980, we see that Walgreen’s has actually managed to double its dividend every five years on average.

The dividend payout ratio has doubled from 16% in 2001 to 30% in 2010. The reason behind this increase was the fact that dividend growth exceeded earnings growth over the past decade. A lower payout is always a plus, since it leaves room for consistent dividend growth minimizing the impact of short-term fluctuations in earnings.

Currently Walgreen’s is trading at 13.90 times earnings, yields 2.50% and has a sustainable dividend payout. The company rarely yields more than 2.50%, so I view the current weakness in the stock price as a good opportunity to add to my position.

Full Disclosure: Long WAG

Relevant Articles:


This article was written by Dividend Growth Investor. If you enjoyed this article, please subscribe to my feed [RSS], or have future articles emailed to you [Email] or follow me on Twitter [Twitter].


Continue Reading »

Philip Morris International - Dividend Increase

Philip Morris International (PM) recently raised its dividend by 20.3%! The new quarterly dividend is $0.77 per share, which is $3.08 annualized. This is a pretty hefty increase from the old quarterly dividend of $0.64.

This 20.3% raise in my dividend income from PM is just one reason why I love dividend growth investing! This is, effectively, like getting a 20% raise at work. The main difference is that I didn't have to do ANYTHING to receive this raise. I didn't have to kiss up to my boss, show up early, stay late or complete an extra project. The only thing I had to do was invest with PM, a high quality international tobacco company that I'm fairly bullish on.

The current yield as of close today on PM is 3.79%, which while pretty strong, is actually fairly low among tobacco companies. The yield based on the new payout is 4.55%. That is a great entry yield for a company that has excellent long-term prospects, in my opinion.

I'm currently long on PM, and am considering adding to my position. I think it's a solid company, and it's a major international player in the tobacco business.

This article was written by Dividend Mantra. If you enjoyed this article, please consider subscribing to my feed.


Continue Reading »

Tandy Not So Dandy

Tandy Brands (TBAC) appears to trade firmly in value territory. While the company trades for just $11 million, Tandy has net current assets of almost $19 million. But it's very easy to see that management is not being candid with shareholders. As such, investors have no reason to believe that management will stop its destruction of shareholder value.


Continue Reading »

High Yielding Large Caps

A clear cut sign that equities are getting cheap again is when you start to see some high yielders in the marketplace. I am not talking about when you seen small cap and mid cap stocks with abnormally high dividend yields that are unsustainable. I am talking about when you see large blue chip companies that have yields which are incredibly high. That is the situation taking place in the market right now.

Look at the industrial giant General Electric (GE) as an example. General Electric has its hand in just about every single aspect of the economy. The company has seen its value plummet over the past few weeks and its shares are trading below the $15 level again. Shares are trading at 11 times earnings which is very reasonable but the hidden value is the fantastic dividend yield. General Electric is yielding over 4%. Investors get to own a value play and collect a juicy dividend at the same time.

Intel (INTC) is back flirting with a valuation in the teens again which isn’t good news for current shareholders. The price does however represent a great long opportunity for investors looking for dividend growth and high yields. The stock has been unfairly punished this year despite posting outstanding earnings. Intel was a good dividend stock when its shares were yielding 3%. Now the stock is a steal with a 4.3% dividend yield. Add in the fact that the company has raised dividend payouts nearly 25% a year over the last decade and you see why Intel is a winner.

Remember that there are always bright spots in every single market. Investors can get fearful and park their money in cash or short tem bonds that have horrible years. The smart move however is to start searching for stocks that are paying dividends so they can generate some kind of positive return during these dips.

Investors should look to load up on shares of big blue chip companies when yields are rising. Companies like these that generate substantial amounts of free cash flow and that have a long term history of paying dividends are safe bets to continue paying out dividends even during market downturns.


This article was written by [Buy Like Buffett]. If you enjoyed this article, please consider subscribing to my feed at [RSS].


Continue Reading »

Stock Analysis: General Dynamics (GD)

Linked here is a detailed quantitative analysis of General Dynamics (GD). Below are some highlights from the above linked analysis:

Company Description: General Dynamics is the world's fifth largest military contractor and also one of the world's biggest makers of corporate jets.

Fair Value: In calculating fair value, I consider the NPV MMA Differential Fair Value along with these four calculations of fair value, see page 2 of the linked PDF for a detailed description:

1. Avg. High Yield Price
2. 20-Year DCF Price
3. Avg. P/E Price
4. Graham Number

GD is trading at a discount to 1.) and 3.) above. Since GD's tangible book value is not meaningful, a Graham number can not be calculated. The stock is trading at a slight discount to its calculated fair value of $65.55. GD earned a Star in this section since it is trading at a fair value.

Dividend Analytical Data: In this section there are three possible Stars and three key metrics, see page 2 of the linked PDF for a detailed description:

1. Free Cash Flow Payout
2. Debt To Total Capital
3. Key Metrics
4. Dividend Growth Rate
5. Years of Div. Growth
6. Rolling 4-yr Div. > 15%

GD earned three Stars in this section for 1.), 2.) and 3.) above. A Star was earned since the Free Cash Flow payout ratio was less than 60% and there were no negative Free Cash Flows over the last 10 years. The stock earned a Star as a result of its most recent Debt to Total Capital being less than 45%.

The company earned a Star for having an acceptable score in at least two of the four Key Metrics measured. The company has paid a cash dividend to shareholders every year since 1979 and has increased its dividend payments for 20 consecutive years.

Dividend Income vs. MMA: Why would you assume the equity risk and invest in a dividend stock if you could earn a better return in a much less risky money market account (MMA) or Treasury bond? This section compares the earning ability of this stock with a high yield MMA. Two items are considered in this section, see page 2 of the linked PDF for a detailed description:

1. NPV MMA Diff.
2. Years to > MMA

GD earned a Star in this section for its NPV MMA Diff. of the $1,616. This amount is in excess of the $1,500 target I look for in a stock that has increased dividends as long as GD has. If GD grows its dividend at 10.8% per year, it will take 4 years to equal a MMA yielding an estimated 20-year average rate of 4.1%. GD earned a check for the Key Metric 'Years to >MMA' since its 4 years is less than the 5 year target.

Memberships and Peers: GD is a member of the S&P 500 a member of the Broad Dividend Achievers™ Index. The company's peer group includes: The Boeing Co. (BA) with a 2.5% yield, Lockheed Martin Corporation (LMT) with a 4.0% yield and Textron Inc. (TXT) with a 0.5% yield.

Conclusion: GD earned one Star in the Fair Value section, earned three Stars in the Dividend Analytical Data section and earned one Star in the Dividend Income vs. MMA section for a total of five Stars. This quantitatively ranks GD as a 5 Star-Very Strong stock.

Using my D4L-PreScreen.xls model, I determined the share price would need to increase to $65.80 before GD's NPV MMA Differential decreased to the $1,500 minimum that I look for in a stock with 20 years of consecutive dividend increases. At that price the stock would yield 2.8%.

Resetting the D4L-PreScreen.xls model and solving for the dividend growth rate needed to generate the target $1,500 NPV MMA Differential, the calculated rate is 10.6%. This dividend growth rate is slightly below the 10.8% used in this analysis, thus providing virtually no margin of safety. GD has a risk rating of 1.25 which classifies it as a Low risk stock.

GD is an important supplier to the U.S. Department of Defense with strategic products such as the M1 Abrams battle tank and Virginia-class nuclear submarines. Defense spending will likely decrease due to budget deficits and shifting military priorities. With 72% of the company's revenue coming from the Department of Defense, the company's earnings will be under pressure. Improving results in Aerospace should help marginally offset declining defense spending.

The stock is trading below my $65.55 calculated fair value price. However, I will be cautious when considering adding to my position due to GD's exposure to future budget cuts.

Disclaimer: Material presented here is for informational purposes only. The above quantitative stock analysis, including the Star rating, is mechanically calculated and is based on historical information. The analysis assumes the stock will perform in the future as it has in the past. This is generally never true. Before buying or selling any stock you should do your own research and reach your own conclusion. See my Disclaimer for more information.

Full Disclosure: At the time of this writing, I was long in GD (0.9% of my Dividend Growth Portfolio). See a list of all my dividend growth holdings here.

Related Articles:
- United Technologies Corp. (UTX) Dividend Stock Analysis
- Harleysville Group Inc. (HGIC) Dividend Stock Analysis
- Illinois Tool Works Inc. (ITW) Dividend Stock Analysis
- Chevron Corporation (CVX) Dividend Stock Analysis
- More Stock Analysis

This article was written by Dividends4Life. If you enjoyed this article, please subscribe to my feed [RSS], or have future articles emailed to you [Email] or follow me on Twitter [Twitter].


Continue Reading »

Weekend Reading Links - September 11, 2011

For your weekend reading pleasure, the articles listed below contain some of the best dividend and value investing insights found on the web. They were written by various members of the Dividend Investing and Value Network over the past week:

Articles From DIV-Net Members

There are some really good articles here, please take time and read a few of them.


Continue Reading »

Stock Analysis: Intel

Intel Corporation (INTC) engages in the design, manufacture, and sale of integrated circuits for computing and communications industries worldwide. It offers microprocessor products used in notebooks, netbooks, desktops, servers, workstations, storage products, embedded applications, communications products, consumer electronics devices, and handhelds. Intel has paid uninterrupted dividends on its common stock since 1992 and increased payments to common shareholders every year for 8 years.

The most recent dividend increase was in July 2011, when the Board of Directors approved a 15.90% increase in the quarterly dividend to 21 cents/share. This was the second consecutive double digit dividend increase for the past year. The largest competitors of Intel include Advanced Micro Devices (AMD), Xilinx (XLNX) and Altera (ALTR).


Over the past decade this dividend growth stock has delivered an annualized total return of 1.40% to its shareholders.

The company has managed to deliver a 30% annual increase in EPS since 2001. The reason for that was the fact that earnings were depressed during the implosion of the tech bubble. Analysts expect Intel to earn $2.37 per share in 2011 and $2.48 per share in 2012. In comparison Intel earned $2.01 /share in 2010. The company has managed to consistently repurchase 2.40% of its common stock outstanding over the past decade through share buybacks.

The return on equity has decreased from after reaching a high of 23% in 2005 and hit a low of 10.80% in 2009. Right now this indicator is on the rebound to above 20%. Rather than focus on absolute values for this indicator, I generally want to see at least a stable return on equity over time.

The annual dividend payment has increased by 25.80% per year over the past decade, which is lower than the growth in EPS.

A 25% growth in distributions translates into the dividend payment doubling almost every 3 years. If we look at historical data, going as far back as 1995, we see that Intel has actually managed to double its dividend every three years on average. Future dividend growth will likely be limited by EPS growth, which I do not expect to exceed the upper single digits over the next decade.

The dividend payout ratio has mostly remained below 50% with the exception of 2008 and 2009. A lower payout is always a plus, since it leaves room for consistent dividend growth minimizing the impact of short-term fluctuations in earnings.

Currently Intel is trading at 9 times earnings, yields 4.20% and appears to have a sustainable dividend payout. The company currently fits my entry criteria, and I would consider initiating a position subject to availability of funds and my portfolio sector allocation.

Full Disclosure: None

Relevant Articles:


This article was written by Dividend Growth Investor. If you enjoyed this article, please subscribe to my feed [RSS], or have future articles emailed to you [Email] or follow me on Twitter [Twitter].


Continue Reading »

Gold As An Investment

This article is inspired by some of the posts I've seen lately around the blogosphere on the benefits and drawbacks of investing in gold. I've never really made my feelings on the shiny metal known on this blog before, so I thought I'd put it down in writing today. First off, I'm not a gold bug or a doomsayer. I'd like to consider myself a pretty level-headed guy, and in such I can see the pros and cons to owning gold. I don't necessarily think it's all-or-nothing. You can own many types of investments, and gold can be a part of your portfolio. That being said gold is very expensive at current prices, and price notwithstanding I dislike owning it for a number of different reasons. My thoughts on gold (and silver to a lesser degree) are as follows:

Why I like dividend growth stocks:

First, let's discuss my motivation for owning dividend growth stocks (which comprise 100% of my portfolio as of today). I'm looking to retire young, hopefully before 40 years old. I define retirement by being financially independent and in a position where passive income meets/exceeds expenses. Dividend stocks pay me to own them. I can invest in a high-quality company like Johnson & Johnson by owning their common stock. In turn, Johnson & Johnson pays me a dividend, quarterly. I can use that dividend to pay expenses, or I can reinvest it. Because I can use those dividends to pay expenses, this investment is a viable approach to retiring young and achieving financial independence (from paid employment).

I look at dividend stocks like this: my portfolio is a fruit tree. My individual positions are branches on that fruit tree. From those branches hang fruit, which are the dividends. I pick the fruit quarterly, as that is the frequency most companies pay dividends. Every quarter I pick the fruit, and the next quarter new fruit grows. This process repeats itself many, many times (hopefully). If I were to sell the stocks by cutting the branches, I would no longer be able to pick that fruit (and pay my bills). That would be an undesirable situation, for many reasons. As long as the fruit grows and I pick it, my bills can be paid.

Why I don't like gold:

Gold does not pay me dividends. In fact, not only does it not pay me to invest in it...but quite the opposite it requires me to pay out additional costs in the form of safe deposit boxes or other storage means in which to keep it safe. This, of course, is only true for the physical form of gold which is the only type I would own. Owning stock in mining companies or GLD doesn't provide the tangible ownership of gold. Paper gold, like GLD, is simply tied to the market's view on the value of gold. You could own GLD for the short-term fluctuations in the price of gold as a commodity, but I think if you are looking for a true long-term store of wealth the physical metal is the way to go.

Gold is one of the only investments, besides true cash, that doesn't provide any type of cash flow. Stocks, bonds, real estate, CD's and even bank accounts provide cash flow in return of an investment. Gold just sits there, and continues to shine. I can see the allure of gold, as holding it in your hand provides some type of mythical elation that has made it popular for thousands of years. But allure doesn't pay my bills. Cash flow does. The only way you can receive cash for gold is when you sell it. Back to my fruit tree example, that is the least desirable option: selling your assets for cash. This would, in my opinion, be akin to buying an empty house as in inflation hedge/investment and then, instead of renting it for positive cash flow, storing it for years and eventually selling it because you need to raise cash. In addition to paying for the house, paying taxes/maintenance fees, and paying a premium to purchase it in the form of brokerage fees, you also paid taxes and fees to sell it. With gold, you pay a premium above spot to buy gold, pay maintenance fees to keep it (safe deposit box), and then pay taxes and additional fees to sell it. During your time of owning gold you received no cash flow. With dividend stocks I received my quarterly fruit, with which I can pay my bills. With real estate you can rent it out. You can't rent out gold. 3 oz. of gold in a safe deposit box doesn't pay my bills, but dividends do.

Another point that is rarely discussed: high-quality companies like Johnson & Johnson produce products that people need. It is because of this that they can continue to raise prices with inflation. This is, in itself, a hedge against inflation. With those rising prices come rising earnings and, in turn, rising dividends. These dividends usually outpace inflation by quite a few points. Gold doesn't earn any money. It doesn't produce anything. Its value is dictated completely by what people are willing to pay for it.

Why I would consider owning gold:

I would consider gold as a very small portion of my portfolio, generally much less than 5%. Once my portfolio crosses the $100k mark I wouldn't mind owning 1-2 oz. of gold and increasing it by 1-2 oz. with every $100k. I would only own the physical metal, not stock. I want it in my hand, not a promise. The main reason, in my mind, for owning it would be as a hedge against some type of economic breakdown. For instance, the dollar collapses or the world economy has some type of major reset. Gold in this type of scenario could be invaluable as a bartering tool. Gold is a store of value: why this is I cannot explain. It's along the same lines as 4-letter words being "bad". Society sets its rules, and therefore it is what it is. Gold has value, and this will probably never change. You can use this to your advantage and have a small portion set aside just in case. I'm an eternal optimist, so I think the odds of actually needing physical precious metals highly unlikely. It is because of this, I'll likely only own a very small portion of it, if any at all.

The opinions above are just my 2 cents (or 1/1000000 oz.).

What about you? Do you invest in gold?

Thanks for reading.

This article was written by Dividend Mantra. If you enjoyed this article, please consider subscribing to my feed.


Continue Reading »

Omnivision: Seeing Value

Omnivision Technologies (OVTI) designs and sells chips that capture digital images. These chips are used in cameras, smartphones, tablets, PCs and a slew of other devices. In just the last two months, the company has lost half of its market value, even though it is well capitalized and trades at a single-digit P/E.


Continue Reading »

Stock Analysis: Diebold, Inc. (DBD)

Linked here is a detailed quantitative analysis of Diebold, Inc. (DBD). Below are some highlights from the above linked analysis:

Company Description: Diebold, Inc. provides ATMs and other self-service transaction systems and security products to the financial, commercial, government and retail markets.

Fair Value: In calculating fair value, I consider the NPV MMA Differential Fair Value along with these four calculations of fair value, see page 2 of the linked PDF for a detailed description:

1. Avg. High Yield Price
2. 20-Year DCF Price
3. Avg. P/E Price
4. Graham Number

DBD is trading at a premium to all four valuations above. The stock is trading at a 12.2% premium to its calculated fair value of $24.04. DBD did not earn any Stars in this section.

Dividend Analytical Data: In this section there are three possible Stars and three key metrics, see page 2 of the linked PDF for a detailed description:

1. Free Cash Flow Payout
2. Debt To Total Capital
3. Key Metrics
4. Dividend Growth Rate
5. Years of Div. Growth
6. Rolling 4-yr Div. > 15%

DBD earned three Stars in this section for 1.), 2.) and 3.) above. A Star was earned since the Free Cash Flow payout ratio was less than 60% and there were no negative Free Cash Flows over the last 10 years. The stock earned a Star as a result of its most recent Debt to Total Capital being less than 45%.

DBD earned a Star for having an acceptable score in at least two of the four Key Metrics measured. The company has paid a cash dividend to shareholders every year since 1954 and has increased its dividend payments for 58 consecutive years.

Dividend Income vs. MMA: Why would you assume the equity risk and invest in a dividend stock if you could earn a better return in a much less risky money market account (MMA) or Treasury bond? This section compares the earning ability of this stock with a high yield MMA. Two items are considered in this section, see page 2 of the linked PDF for a detailed description:

1. NPV MMA Diff.
2. Years to > MMA

DBD earned a Star in this section for its NPV MMA Diff. of the $523. This amount is in excess of the $500 target I look for in a stock that has increased dividends as long as DBD has. The stock's current yield of 4.15% exceeds the 4.1% estimated 20-year average MMA rate.

Memberships and Peers: DBD is and a member of the Broad Dividend Achievers™ Index and a Dividend Champion. The company's peer group includes: The NCR Corp. (NCR) with a 0.0% yield, Stratasys Inc. (SSYS) with a 0.0% yield and Avid Technology Inc. (AVID) with a 0.0% yield.

Conclusion: DBD did not earn any Stars in the Fair Value section, earned three Stars in the Dividend Analytical Data section and earned one Star in the Dividend Income vs. MMA section for a total of four Stars. This quantitatively ranks DBD as a 4 Star-Strong stock.

Using my D4L-PreScreen.xls model, I determined the share price would need to increase to $27.27 before DBD's NPV MMA Differential decreased to the $500 minimum that I look for in a stock with 58 years of consecutive dividend increases. At that price the stock would yield 4.1%.

Resetting the D4L-PreScreen.xls model and solving for the dividend growth rate needed to generate the target $500 NPV MMA Differential, the calculated rate is 3.6%. This dividend growth rate is slightly below the 3.7% used in this analysis, thus providing virtually no margin of safety. DBD has a risk rating of 1.25 which classifies it as a Low risk stock.

At 58 years, DBD is the current reigning champion of consecutive dividend increases. In spite of the company's cyclical business, it has been able to maintain relatively stable financial metrics over time.

DBD's 4% yield and favorable current rating is enticing. However, not enough to overcome my concerns of declining earnings and free cash flow. In addition it is trading at a 12% premium to my calculated fair value price of $24.04. I will wait for a more opportune time before buying.

Disclaimer: Material presented here is for informational purposes only. The above quantitative stock analysis, including the Star rating, is mechanically calculated and is based on historical information. The analysis assumes the stock will perform in the future as it has in the past. This is generally never true. Before buying or selling any stock you should do your own research and reach your own conclusion. See my Disclaimer for more information.

Full Disclosure: At the time of this writing, I held no position in DBD (0.0% of my Dividend Growth Portfolio). See a list of all my dividend growth holdings here.

Related Articles:
- Illinois Tool Works Inc. (ITW) Dividend Stock Analysis
- Chevron Corporation (CVX) Dividend Stock Analysis
- Vectren Corporation (VVC) Dividend Stock Analysis
- Leggett & Platt, Inc. (LEG) Dividend Stock Analysis
- More Stock Analysis

This article was written by Dividends4Life. If you enjoyed this article, please subscribe to my feed [RSS], or have future articles emailed to you [Email] or follow me on Twitter [Twitter].


Continue Reading »

Weekend Reading Links - September 4, 2011

For your weekend reading pleasure, the articles listed below contain some of the best dividend and value investing insights found on the web. They were written by various members of the Dividend Investing and Value Network over the past week:

Articles From DIV-Net Members

There are some really good articles here, please take time and read a few of them.


Continue Reading »

Novartis Stock Analysis

Novartis AG (NVS), through its subsidiaries, engages in the research, development, manufacture, and marketing of healthcare products worldwide. Novartis is an international dividend achiever, has paid uninterrupted dividends on its common stock since 1992 and increased payments to common shareholders every year for 14 years.

The most recent dividend increase was in November 2010, when the Board of Directors approved a 4.80% increase to 2.20 CHF/share. The largest competitors of Novartis include Pfizer (PFE), Merck (MRK) and GlaxoSmithKline (GSK).


Over the past decade this dividend growth stock has delivered an annualized total return of 8% to its shareholders.

The company has managed to deliver an increase in EPS of 11.30% per year since 2001. Analysts expect Novartis to earn $5.51 per share in 2011 and $5.73 per share in 2012. In comparison Novartis earned $4.26 /share in 2010. The company has managed to consistently repurchase 2.10% of its common stock outstanding over the past decade through share buybacks.


The return on equity has decreased from 18% in 2001 to 15.50% in 2010. Rather than focus on absolute values for this indicator, I generally want to see at least a stable return on equity over time.

The annual dividend payment in US Dollars has increased by 18.70% per year over the past decade, which is higher than the growth in EPS. The increase in dividends in Swiss Francs has increased by 10.50% per year since 2001.

A 10% growth in distributions translates into the dividend payment doubling almost every 7years. If we look at historical data, going as far back as 1997, we see that Novartis has actually managed to double its dividend every six and a half years on average.

The dividend payout ratio is currently above 50%, although just by a few percentage points. A lower payout is always a plus, since it leaves room for consistent dividend growth minimizing the impact of short-term fluctuations in earnings.

Currently Novartis is trading at 14.80 times earnings, yields 3.20% and has a sustainable dividend payout. The company currently fits my entry criteria, and I would consider initiating a position subject to availability of funds and my portfolio sector allocation.

Full Disclosure: None

Relevant Articles:


This article was written by Dividend Growth Investor. If you enjoyed this article, please subscribe to my feed [RSS], or have future articles emailed to you [Email] or follow me on Twitter [Twitter].


Continue Reading »

Dividend Income Update - August 2011

August has come and gone and it seems like it just started yesterday. Sometimes I truly cannot believe how fast time flies by. I don't mean to say this as a cliche. I actually mean that time seems to fly by for me. This is just one of many reason I would like to retire so early in life. Once time is behind you, there is no way to get it back. I want to harness as much of that limited time as possible!

I've tallied up the dividends received from August, and it's very close to the total received in July. It's not a huge number, and I've said before that my dividends are pretty small potatoes compared to other bloggers' dividends...but it's still just starting for me. I think it won't be long before I'm looking back on these totals with a big smile as I see where it all began.

August 2011 Dividends Received

  • Abbott Laboratories (ABT) - $34.08
  • Procter & Gamble (PG) - $26.78
Total dividends received for the month of August: $60.86.

Overall, it was as expected for this month. I had only two positions paying out in August, although they are two of my larger positions. I think I'm very close to the point where double-digit dividend totals are behind me. I look very much forward to receiving dividends over $100 every single month. At any rate, this is passive income...so I didn't work to receive it. I'm very happy to receive anything at all as quality companies are paying me to invest in them. I'm just incredibly excited every time I log in to my brokerage account to see fresh capital deposited and ready to invest! I can think of few things more exciting.

I'm behind my goal of producing $1,200 in total dividend income for the year of 2011. I have produced a total of $618.57 in dividends through August. I'll have a pretty tough time making up ground and reaching my goal with only four months to go and it's highly unlikely I'll actually reach it. That's OK, as it's fun setting up a fairly difficult goal for myself and seeing how close I can get to it. If you aim for the lowest star, you're sure to reach it. I like to see how high in the sky I can fly!

I'll update my dividend income page to reflect August's dividends.

Thanks for reading.

This article was written by Dividend Mantra. If you enjoyed this article, please consider subscribing to my feed.


Continue Reading »