


In my latest article, I reviewed the methodology used for the dividend discount model. As I concluded, any valuation methods require a lot more than simple calculations in a spreadsheet. In order to find the intrinsic value of a share, it is important to pursue a complete analysis of the whole company. The usage of tools such as a spreadsheet could save you lots of time, but could also result in a catastrophe in your buying process if you don’t pay attention. The smallest variation of any metric could have you pass on a marvelous company or make you buy an overvalued stock at a very bad time. I will show you how a variation of 1% could completely alter the perception you have of the value of a company’s share.
In order to do so, we will start with the previous article’s assumptions for McCormick (MKC):

Dividend Growth Rate 1-10 year – Variation of 1%
Fortunately, the first metric to determine is the easiest one and the one that has the least impact on your valuation. If we expect the dividend growth rate for the year 1 to 10 to be 7.50%, MKC intrinsic value is $96.06. However, if we are more pessimistic and determine that the growth rate should be 6.50%, the intrinsic value drops only by $7.92 to 88.14. The impact of 1% less has an impact of 8.24% on the stock price. If you are optimistic, the value climbs by $8.60 to $104.66.Then, the variation of 1% more has an impact of 8.95% on the stock price.
When I determine the value of a company share, I always keep in mind that the first 10 years’ dividend growth rate could affect the intrinsic value by roughly 10% (up or down). Since we already know that the dividend discount model is not perfect, this is a small variation compared to the power of the two last metrics.
Terminal Dividend Growth Rate – Variation of 1%
Intuitively, the terminal growth rate will have a bigger impact in my calculation. This is because we use this growth rate at perpetuity, forever. This is also the reason why I use a smaller number than the short term growth rate. I want to make sure that my calculations are as conservative as possible. With MKC, using a smaller growth rate of 6% instead of 7% brings back the intrinsic value to $68.86.This is a $27.20-dollar difference or 28.32% of the previous intrinsic value. As you can see, this makes a whole difference in the appreciation of a stock. Then again, if we boost the dividend growth rate at 8%, we have an intrinsic value of $177.67. This is an enormous difference of $81.61 more or 84.96% more than the previous intrinsic value. The simple variation of 1% up or down in the dividend growth rate could give you a value anywhere between $68.86 and $177.67. This shows you how fragile the result of your calculation is. Therefore, when you think you have found “THE VALUE” of a company, remind yourself of this example.
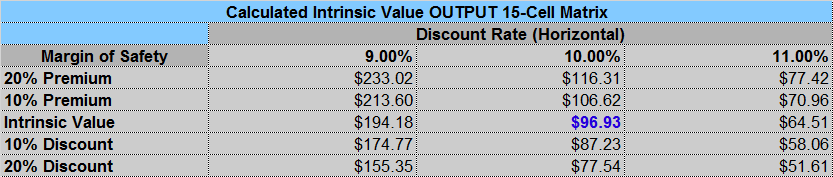
Discount Rate
The Dividend Toolkit Calculation Spreadsheet already includes a 1% variation of the discount rate:

You can see that the discount rate variation is the most important metric. It amplifies all the other inputs. Then again, if you are getting too complacent and use a low discount rate, you will find the that whole market is cheap. On the other hand, if you request a 10-11% discount rate in all your analysis, you will probably not buy anything for years.
It’s a Combination of Numbers
The other thing that is very important to keep in mind is all these metrics are interrelated. Therefore, you can be very generous on the dividend growth rate and require a higher discount rate and it will almost come down to the same thing. For example, if you use a dividend growth rate of 8.50% for the first 10 years and keep it at 8% for the terminal rate but use a discount rate of 10% instead of 9%, you get a value of $96.63. It is interesting how +1% everywhere brings you back to virtually the same value, isn’t?

 How can you make the right assumptions?
It’s impossible to remain 100% certain that you have the right assumptions. In fact, even if you are a math wiz, you can’t predict the future. Therefore, even if your assumptions are “right”, they could be hit by any storm 5 years from now. How can you make any sense from your calculations then? This is an interesting question.
I’ve solved this question by using a complete analysis process based on 7 dividend investing principles. The valuation is part of 1 principle and I also rely on the 6 others to make sure the companies I select are strong dividend payers. If the company has a strong business model and shows strong metrics, I might end-up buying at a cheap price or an expensive one, but the quality of my portfolio will be improved. To be honest, I don’t really mind about the intrinsic value of a company today, I’m more interested in its valuation 25 years from now.
This article was written by Dividend Monk. If you enjoyed this article, please subscribe to my feed [RSS]
This article was written by Dividend Monk. If you enjoyed this article, please subscribe to my feed [RSS]


