Recent Posts From DIV-Net Members

Mini Dividend Portfolio

Many Canadian Investors are starting to look towards dividend investing after their experience from the recent market crash. While this strategy is well-suited to long-term investors, many newbies don't know where to start.

Here are my top 6 picks for Canadian investors. These stocks can be viewed as building blocks to form the foundation of a dividend portfolio. All of these stocks have a solid track-record of dividend growth.

TD Bank is Canada’s second largest bank, serving more than 13 million customers worldwide. TD also has a significant U.S. presence.

Shaw Communications is a diversified communications company whose core business is providing broadband cable television, Internet, telecommunications services and satellite services. Shaw serves more than 3 million customers.

Enbridge operates the world's longest crude oil and liquids transportation system in North America. Enbridge also owns and operates Canada's largest natural gas distribution company.

Fortis is the largest investor-owned distribution utility in Canada, serving more than 2 million gas and electricity customers.

Diageo is the world's leading producer of branded premium spirits. Diageo’s portfolio of brands includes Smirnoff, Johnnie Walker, Baileys, Guinness and Tanqueray.

Johnson & Johnson is the largest and most diverse health care company in the world. The company focuses on pharmaceuticals, consumer products and medical devices.

This "mini portfolio" is 2/3 Canadian and 1/3 Foreign. Keep in mind that foreign securities are better held in tax-deferred accounts (RSP, TFSA)

"This article was written by Think Dividends. You may email questions or comments to me at thinkdividends@gmail.com."


Note: No buy or sell is recommendations are implied by the author. Portfolio decisions should reflect your investment objectives, personal preferences, risk tolerance, diversification views, return expectations, time horizon and income requirements. Do your own homework before making investment decisions.


Continue Reading »

Investing Scams to Watch Out For

The trouble with investing is that it is a slow process. It can take years to see results and achieve your goals. However, it is human nature to want things now and this can create a problem for investors as it can make us reach for unrealistic things. This is where investor scammers step in and try to take advantage of greedy investors. Here are list of a few of the know scams out there. Watch out for these!

The Pump and Dump

If you are on investment forums at all, you probably have seen this in one form or another.  It is simply an investor, or groups of investors, buying a stock in a company and then using specific tactics to move the share price of that stock higher.  These tactics can include using forums and fake news releases to spread mis-information about a company which suckers react to.  These people can be very convincing so always be on our guard.

Newsletters

There are investing newsletters out there that are genuine and the real deal.  Trouble is, there are also a lot of newsletters whose business is only to sell subscriptions as opposed to selling good investment advice.  The unscrupulous newsletter writers really have no interest in how well you do as an investor.  Be sure to check out online reviews of the newsletters (but make sure those reviews are genuine) to be sure the newsletter you are interested in is valid. Better yet, learn how to do the investing yourself so you do not need to rely on newsletters.

Anything Claiming High Return for Low Risk

This is the holy grail of investment scams:  offering investors a way to double, triple, earn 40% of their money with absolutely no risk.  This is impossible and if anyone tries to convince you otherwise, run far away.  Earning a above average return investing requires a certain amount of risk.  If it sounds too good to be true it is!

This article was written by The Dividend Guy. To learn more about dividend investing, please follow my RSS feed or Twitter account.


Continue Reading »

Stock Analysis: McGrath RentCorp (MGRC)

Linked here is a detailed quantitative analysis of McGrath RentCorp (MGRC). Below are some highlights from the above linked analysis:

Company Description: McGrath RentCorp rents and sells modular buildings and electronic test and measurement equipment; and manufactures and sells portable classrooms.

Fair Value: I consider four calculations of fair value, see page 2 of the linked PDF for a detailed description:

  1. Avg. High Yield Price
  2. 20-Year DCF Price
  3. Avg. P/E Price
  4. Graham Number
MGRC is trading at a discount to only 1.) above. The stock is trading at a slight discount to its calculated fair value of $25.70. MGRC earned a Star in this section since it is trading at a fair value.

Dividend Analytical Data: In this section there are three possible Stars and three key metrics, see page 2 of the linked PDF for a detailed description:
  1. Free Cash Flow Payout
  2. Debt To Total Capital
  3. Key Metrics
  4. Dividend Growth Rate
  5. Years of Div. Growth
  6. Rolling 4-yr Div. > 15%
MGRC earned one Star in this section for 3.) above. MGRC earned a Star for having an acceptable score in at least two of the four Key Metrics measured. The company has paid a cash dividend to shareholders every year since 1990 and has increased its dividend payments for 17 consecutive years.

Dividend Income vs. MMA: Why would you assume the equity risk and invest in a dividend stock if you could earn a better return in a much less risky money market account (MMA)? This section compares the earning ability of this stock with a high yield MMA. Two items are considered in this section, see page 2 of the linked PDF for a detailed description:
  1. NPV MMA Diff.
  2. Years to > MMA
MGRC earned a Star in this section for its NPV MMA Diff. of the $2,479. This amount is in excess of the $1,800 target I look for in a stock that has increased dividends as long as MGRC has. If MGRC grows its dividend at 10.3% per year, it will take 2 years to equal a MMA yielding an estimated 20-year average rate of 3.98%. MGRC earned a check for the Key Metric 'Years to >MMA' since its 2 years is less than the 5 year target.

Other: MGRC is a member of the Broad Dividend Achievers™ Index.

Conclusion: MGRC earned one Star in the Fair Value section, earned one Star in the Dividend Analytical Data section and earned one Star in the Dividend Income vs. MMA section for a total of three Stars. This quantitatively ranks MGRC as a 3 Star-Hold.

Using my D4L-PreScreen.xls model, I determined the share price would need to increase to $27.63 before MGRC's NPV MMA Differential decreased to the $1,800 minimum that I look for in a stock with 17 years of consecutive dividend increases. At that price the stock would yield 3.11%.

Resetting the D4L-PreScreen.xls model and solving for the dividend growth rate needed to generate the target $1,800 NPV MMA Differential, the calculated rate is 9.1%. This dividend growth rate is slightly less than the 10.1% used in this analysis, thus providing a small margin of safety. MGRC has a risk rating of 1.50 which classifies it as a low risk stock.

MGRC's debt to total capital is currently at 50% and the company has seen negative free cash flow in 6 of the last 10 years. Even though MGRC is trading below my $25.70 fair value price, I will not give it serious consideration until the company lowers its debt to total capital to below 45% and goes 10 years without negative free cash flow. For additional information, including the stock's dividend history, please refer to its data page.

Disclaimer: Material presented here is for informational purposes only. The above quantitative stock analysis, including the Star rating, is mechanically calculated and is based on historical information. The analysis assumes the stock will perform in the future as it has in the past. This is generally never true. Before buying or selling any stock you should do your own research and reach your own conclusion. See my Disclaimer for more information.

Full Disclosure: At the time of this writing, I held no position in MGRC (0.0% of my Income Portfolio). See a list of all my income holdings here.


Recent Stock Analyses:


Continue Reading »

Weekend Reading Links - March 28, 2010

For your weekend reading pleasure, the articles listed below contain some of the best dividend and value investing insights found on the web. They were written by various members of the Dividend Investing and Value Network over the past week:

Articles From DIV-Net Members

There are some really good articles here, please take time and read a few of them.


Continue Reading »

PepsiCo (PEP) Stock Analysis

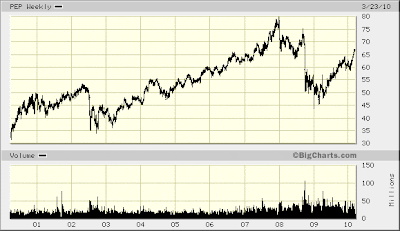
PepsiCo, Inc. (PEP) manufactures, markets, and sells various foods, snacks, and carbonated and non-carbonated beverages worldwide. The company is a member of the S&P Dividend Aristocrat index, after raising distributions for 38 years in a row. Most recentlyPepsiCo raised its quarterly dividend payment by 7% to $0.48/share. Dividend author Dave Van Knapp has included the company in his most recent book "The Top 40 Dividend Stocks for 2010".

The stock has returned a 7.60% average annual return over the past decade, fueled by the company’s strong growth in earnings.


Since the year 2000, PepsiCo has managed to deliver a 9.90% average annual increase in earnings per share. The company has also managed to implement a share buyback where it purchased almost 1.7% of outstanding stock on average each year since 2001. After it acquired Pepsi Bottling Co. and PepsiAmericas the company's Board of Directors also authorized the repurchase of up to $15 billion of PepsiCo common stock through June 2013. At current prices this represents approximately 14.40% of the stock outstanding.

Analysts are expecting EPS growth to $4.17 in FY 2010, which would be a 10.60% increase in comparison to FY2009 EPS of $3.77. The expectations for FY 2011 are for EPS to reach $4.65, which would be an 11.50% increase.

Earnings growth could come from synergies associated with the acquisitions of its bottlers, streamlining of operations and cost cutting. The distribution networks of the bottlers acquired could be used to push some of PepsiCo’s non-beverage products such as snacks and other foods.
Earnings growth could also come from strategic acquisitions, as well as product innovations in health and wellness food and beverage section.

The return on equity has remained largely above 30%, with the exception of 2004, when it fell to as low as 22%.


Annual dividend payments have increased by 13.60% on average since 2000, which is much higher than the growth in earnings per share.


A 13.60% growth in dividends translates into the dividend payment doubling almost every five years. Since 1979 PepsiCo has actually managed to double its dividend payment every six years on average.


The dividend payout has remained below 50%, with the exception of a brief increase in 2008. A lower payout is always a plus, since it leaves room for consistent dividend growth minimizing the impact of short-term fluctuations in earnings.

PepsiCo (PEP) is a reliable dividend stock, which is attractively priced at the moment despite its forward yield of 2.90% being a tad lower than my entry requirement of 3%. My ideal entry price for PepsiCo would be $64. Dividend Investors waiting for better prices should weigh in the risks of waiting for a better price, versus the risk of missing out completely on any upside action if the company doesn’t go below $64/share.

Full Disclosure: Long PEP
Relevant Articles:


This article was written by Dividend Growth Investor. If you enjoyed this article, please vote for it by clicking the Buzz Up! button below.


Continue Reading »

Running Out Of Cash

When a stock has strong earnings growth, it can result in excellent stock returns, particularly if the investor paid a conservative price for the company's shares. What is often overlooked, however, is that earnings growth must be financed. That is, the company must spend on marketing, inventory, equipment and capacity before that growth can be realized. This can lead to a situation where a company runs out of cash, despite a rosy outlook, which can hurt investors caught unaware.

Consider Digital Ally (DGLY), a provider of in-car digital video equipment for law enforcement authorities. The company has grown its revenue sharply in the last five years, as demand for its products has grown considerably. Earnings appear poised to continue to grow, as the company has increased its sales staff internationally, and is starting to sell its products to new markets (e.g. taxis, private investigators, trucking companies, military, private security forces).

There's only one problem: liquidity. Even healthy companies that grow their earnings quickly need financing to fund that growth, and Digital Ally is no exception. Operating cash flow has been positive only once in the last five years, as cash has been needed to finance growth in the company's working capital. Cash requirements appear to continue to be high, as in the fourth quarter of 2009, the company had to spend on SG&A to grow its staff and capacity to take advantage of new market opportunities.

Now, however, with ambitious growth plans, the company sits with just $183 thousand of cash on hand. So what's it going to do? While the company does have an unused credit facility of $2.5 million, debt for a small company with volatile earnings could be expensive. Instead, the company appears to prefer to save cash by paying a large part of its expenses with stock options. In 2009 alone, the company paid $1.4 million of its SG&A in options, which is several times the company's current cash balance! As a result, the company has almost 5 million options outstanding, while the company only has 15 million shares!

Growing earnings are good, but shareholders must recognize that such companies require investment. If that investment cannot be made in cash, shareholders may be severely diluted, reducing the attractiveness of the investment. As a result, shareholders who don't consider the sources of cash that growing companies need may be unaware of the price they are paying.

Disclosure: None

This article was written by Saj Karsan of Barel Karsan. If you enjoyed this article, please vote for it by clicking the Buzz Up! button below.


Continue Reading »

Stock Analysis: Kimberly Clark Corp. (KMB)

Linked here is a detailed quantitative analysis of Kimberly Clark Corp. (KMB). Below are some highlights from the above linked analysis:

Company Description: Kimberly Clark Corp. is a global consumer products company produces tissue, personal care and health care. Its brands include Huggies, Pull-Ups, Kotex, Depend, Kleenex, Scott and Kimberly-Clark.

Fair Value: I consider four calculations of fair value, see page 2 of the linked PDF for a detailed description:

  1. Avg. High Yield Price
  2. 20-Year DCF Price
  3. Avg. P/E Price
  4. Graham Number
KMB is trading at a discount to 1.) and 3.) above. The stock is trading at a 21.4% discount to its calculated fair value of $78.13. KMB earned a Star in this section since it is trading at a fair value.

Dividend Analytical Data: In this section there are three possible Stars and three key metrics, see page 2 of the linked PDF for a detailed description:
  1. Free Cash Flow Payout
  2. Debt To Total Capital
  3. Key Metrics
  4. Dividend Growth Rate
  5. Years of Div. Growth
  6. Rolling 4-yr Div. > 15%
KMB earned two Stars in this section for 1.) and 3.) above. A Star was earned since the Free Cash Flow payout ratio was less than 60% and there were no negative Free Cash Flows over the last 10 years. KMB earned a Star for having an acceptable score in at least two of the four Key Metrics measured. The company has paid a cash dividend to shareholders every year since 1935 and has increased its dividend payments for 38 consecutive years.

Dividend Income vs. MMA: Why would you assume the equity risk and invest in a dividend stock if you could earn a better return in a much less risky money market account (MMA)? This section compares the earning ability of this stock with a high yield MMA. Two items are considered in this section, see page 2 of the linked PDF for a detailed description:
  1. NPV MMA Diff.
  2. Years to > MMA
KMB earned a Star in this section for its NPV MMA Diff. of the $1,556. This amount is in excess of the $500 target I look for in a stock that has increased dividends as long as KMB has. The stock's current yield of 4.3% exceeds the 3.98% estimated 20-year average MMA rate.

Other: KMB is a member of the S&P 500, a Dividend Aristocrat and a member of the Broad Dividend Achievers™ Index.

Conclusion: KMB earned one Star in the Fair Value section, earned two Stars in the Dividend Analytical Data section and earned one Star in the Dividend Income vs. MMA section for a total of four Stars. This quantitatively ranks KMB as a 4 Star-Buy.

Using my D4L-PreScreen.xls model, I determined the share price would need to increase to $87.80 before KMB's NPV MMA Differential decreased to the $500 minimum that I look for in a stock with 38 years of consecutive dividend increases. At that price the stock would yield 3.01%.

Resetting the D4L-PreScreen.xls model and solving for the dividend growth rate needed to generate the target $500 NPV MMA Differential, the calculated rate is 3.0%. This dividend growth rate is less than the 6.7% used in this analysis, thus providing a margin of safety. KMB has a risk rating of 1.75 which classifies it as a medium risk stock.

I have recently avoided KMB due to relatively high debt levels. I generrally look for dividend stocks with debt to total capital less than 45%. Although KMB's at 50% is above that level, it has consistently dropped from 61% back in July to to its present level. This is a sign of good management. I will look to add to my KMB position while it is trading below my $78.13 fair value price. For additional information, including the stock's dividend history, please refer to its data page.

Disclaimer: Material presented here is for informational purposes only. The above quantitative stock analysis, including the Star rating, is mechanically calculated and is based on historical information. The analysis assumes the stock will perform in the future as it has in the past. This is generally never true. Before buying or selling any stock you should do your own research and reach your own conclusion. See my Disclaimer for more information.

Full Disclosure: At the time of this writing, I was long in KMB (0.7% of my Income Portfolio). See a list of all my income holdings here.


Recent Stock Analyses:
This article was written by Dividends4Life. If you enjoyed this article, please vote for it by clicking the Buzz Up! button below. [RSS] [Email] [Twitter]


Continue Reading »

Weekend Reading Links - March 21, 2010

For your weekend reading pleasure, the articles listed below contain some of the best dividend and value investing insights found on the web. They were written by various members of the Dividend Investing and Value Network over the past week:

Articles From DIV-Net Members

>There are some really good articles here, please take time and read a few of them.


Continue Reading »

Fact and Fiction

I have a problem- I hate listening to people hyperbolize returns on investments- especially those specific to real estate investments. Keeping in mind that I think real estate can be an excellent investment when done right- but lets not get carried away with things. Here, let me give you an example.

I received a newsletter the other day from an email list I subscribe to- normally the articles are very informative and give some great insight. This most recent article though was about investing in real estate, the author started out with: “Did you know that throughout time, the richest people in the world have all owned a great deal of real estate? “ I sighed, gross generalizations aside they probably also owned bonds and stocks too- so what?

Our author goes on to show the following graph:


And then make the point that an investment in real-estate in 1963 would net “a 1200% gross profit” today.


I like graphs- big fan. There are a few problems I have with this specific graph though:
  • This graph speaks to the average US household, unless you own hundreds of properties scattered across the US you simply will not see these returns (REITs aside- keep in mind our author was talking about direct real-estate investment).


  • The other issue I have is that there is no adjustment for inflation on this chart. Looking at the chart it shows an average house worth $25,000 in 1963 dollars, but using an average of 4.3% inflation through these years that amounts to $180,625 in 2010 dollars. Using the 2010 average sell price of $275K this would net you a profit of $94,375 inflation adjusted dollars. Considering that you had to wait 47 years for that return I put that in the ok return pile- not the wow pile. Certainly not the 1200% gross profit our author espouses.


  • Lets not forget all the tax you would have paid buying the house(agent fees), holding the house (government), and selling the house (agent fees again).  These too eat into the potential profit.


  • My final point, have you ever known a house that didn’t need to be rebuilt or repaired over the course of 47 years- no? Neither have I- their goes the majority of the rest of your profit.

Real estate can be a good investment. Buy a property below market value that doesn’t require lots of work, in a good area, get a renter to pay the mortgage and pay you some returns and enjoy. Don’t get wrapped up in the 1200% gross profit nonsense.

This article was written by buyingvalue. If you enjoyed this article, please vote for it by clicking the Buzz Up! button below.


Continue Reading »

Emerson Electric (EMR) Stock Analysis

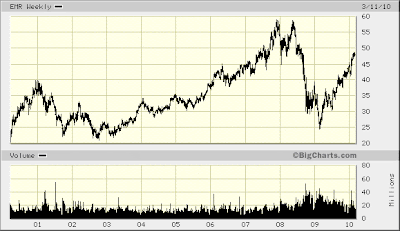
Emerson Electric Co., is a diversified global technology company, that engages in designing and supplying product technology, as well as delivering engineering services and solutions to various industrial, commercial, and consumer markets worldwide. The company is a member of the dividend aristocrat index, having raised distributions for 53 consecutive years. Dividend author Dave Van Knapp has included the company in his most recent book "The Top 40 Dividend Stocks for 2010".

Over the past decade this dividend growth stock has delivered an annual average total return of 7% to its shareholders. The stock is up almost 100% from its 2009 lows.


The company has managed to deliver a 3.60% average annual increase in its EPS between 2000 and 2009. Analysts are expecting an increase in EPS to $2.41 in 2010 and $2.90 by 2011, which would be an increase from FY 2009 EPS of $2.27. Short-term results showed that despite the diversified business conducted in five major segments, the company is not immune to cyclical movements in the overall economy. After steep declines in revenues in 2009, analysts expect Emerson to report flat revenues in FY 2010, followed by an increase as a result of the pickup in economic activity later this year. The company is focusing its long-term growth efforts in emerging markets, telecom and retail industries as well as services, power generation and process automation technologies as well as product innovation.


The Return on Equity has increased over the past decade from a low of 14.50% in 2000 to 19.50% in 2009. Rather than focus on absolute values for this indicator, I generally want to see at least a stable return on equity over time.

The annual dividend payment has increased by an average of 7% annually since 2000, which is slightly lower than the growth in EPS.


A 7 % growth in dividends translates into the dividend payment doubling every 10 years. If we look at historical data, going as far back as 1982, Emerson Electric Co. has actually managed to double its dividend payment every nine years on average.

The dividend payout ratio remained below 50% for the majority of the past decade. The only exception were the 2001-2003 and 2009 periods, because profitability suffered from economic downturns at the time. A lower payout is always a plus, since it leaves room for consistent dividend growth minimizing the impact of short-term fluctuations in earnings.


Currently Emerson Electric is trading at a Price to Earnings multiple of 21.50, yields 2.80% and has a dividend payout that is higher than 50%. Despite the fact that the company has a good business model, the stock is slightly overvalued at the moment. I would only add to my position in the stock on dips below $45.

Full Disclosure: Long EMR

Relevant Articles:

- Dividend Aristocrats List for 2010
- Ten Dividend Kings raising dividends for over 50 years
- Where are the original Dividend Aristocrats now?
- Estimating future Dividend Growth

This article was written by Dividend Growth Investor. If you enjoyed this article, please vote for it by clicking the Buzz Up! button below.


Continue Reading »

Investing And Uncertainty

Humans don't like ambiguity. This is demonstrated in the experiment Hersh Shefrin discusses where subjects are offered either a guaranteed $1000, or a 50/50 chance at $2000. Consistently, fewer than 50% of respondents prefer the gamble for $2000, even though the expected values (i.e. the average value of the result if it were conducted many times) of both offers are the same.

What if the 50/50 odds in the above experiment were instead unknown? This adds even further uncertainty to the situation, and results in even fewer people willing to gamble on the $2000.

Shefrin calls this phenomenon "aversion to ambiguity", and on Wall Street it results in downward pressure on the prices of securities with uncertain outlooks. In order to avoid uncertainty/ambiguity, humans will stay away, even if the odds are favourable (i.e. downside risk is low, upside potential is high).

In his book, Shefrin argues that this ambiguity aversion is the reason for government intervention, even when it is not needed. What would have happened had the government not bailed out the banks? Nobody really knows, but the fact that the outlook was uncertain made the government want to intervene, even at a high cost, in order to avoid the uncertain situation.

As Mohnish Pabrai notes in his book, risk is not the same as uncertainty. Uncertainty can drive down the prices of assets/securities, even if downside risk is low. By capitalizing on situations where uncertainty is high, but risk is low, the investor can put himself in a position to earn above-average returns.

Disclosure: Author would roll the dice on the $2000 as long as the odds were 50%+


This article was written by Saj Karsan of Barel Karsan. If you enjoyed this article, please vote for it by clicking the Buzz Up! button below.


Continue Reading »

Stock Analysis: Leggett & Platt Inc. (LEG)

Linked here is a detailed quantitative analysis of Leggett & Platt Inc. (LEG). Below are some highlights from the above linked analysis:

Company Description: Leggett & Platt Inc makes a broad line of bedding and furniture components and other home, office and commercial furnishings, as well as diversified products for non-furnishings markets.

Fair Value: I consider four calculations of fair value, see page 2 of the linked PDF for a detailed description:

  1. Avg. High Yield Price
  2. 20-Year DCF Price
  3. Avg. P/E Price
  4. Graham Number
LEG is trading at a discount to only 3.) above. Since LEG's tangible book value is not meaningful, a Graham number can not be calculated. The stock is trading at a 62.8% premium to its calculated fair value of $13.08. LEG did not earn any Stars in this section.

Dividend Analytical Data: In this section there are three possible Stars and three key metrics, see page 2 of the linked PDF for a detailed description:
  1. Free Cash Flow Payout
  2. Debt To Total Capital
  3. Key Metrics
  4. Dividend Growth Rate
  5. Years of Div. Growth
  6. Rolling 4-yr Div. > 15%
LEG earned three Stars in this section for 1.), 2.) and 3.) above. A Star was earned since the Free Cash Flow payout ratio was less than 60% and there were no negative Free Cash Flows over the last 10 years. The stock earned a Star as a result of its most recent Debt to Total Capital being less than 45%. LEG earned a Star for having an acceptable score in at least two of the four Key Metrics measured. The company has paid a cash dividend to shareholders every year since 1939 and has increased its dividend payments for 38 consecutive years.

Dividend Income vs. MMA: Why would you assume the equity risk and invest in a dividend stock if you could earn a better return in a much less risky money market account (MMA)? This section compares the earning ability of this stock with a high yield MMA. Two items are considered in this section, see page 2 of the linked PDF for a detailed description:
  1. NPV MMA Diff.
  2. Years to > MMA
LEG earned a Star in this section for its NPV MMA Diff. of the $563. This amount is in excess of the $500 target I look for in a stock that has increased dividends as long as LEG has. The stock's current yield of 4.88% exceeds the 3.98% estimated 20-year average MMA rate.

Other: LEG is a member of the S&P 500 and a member of the Broad Dividend Achievers™ Index.

Conclusion: LEG did not earn any Stars in the Fair Value section, earned three Stars in the Dividend Analytical Data section and earned one Star in the Dividend Income vs. MMA section for a total of four Stars. This quantitatively ranks LEG as a 4 Star-Buy.

Using my D4L-PreScreen.xls model, I determined the share price would need to increase to $21.97 before LEG's NPV MMA Differential decreased to the $500 minimum that I look for in a stock with 38 years of consecutive dividend increases. At that price the stock would yield 4.73%.

Resetting the D4L-PreScreen.xls model and solving for the dividend growth rate needed to generate the target $500 NPV MMA Differential, the calculated rate is 1.6%. This dividend growth rate is less than the 2.0% used in this analysis, thus providing a margin of safety. LEG has a risk rating of 1.50 which classifies it as a low risk stock.


A sign of a well managed company is the ability to increase cash flow in the face of falling sales and earnings. LEG's sales and earnings peaked in 2006. However, free cash flow per share has doubled since that time. 2010 should not be any different with S&P forcasting LEG's customer markets recovering late this year and moving to positive sales growth. Earlier this month I initiated position in LEG in spite of the fact it was trading well in excess of my $17.94 fair value price. Since then, LEG has appreciated an additional 5%. For additional information, including the stock's dividend history, please refer to its data page.

Disclaimer: Material presented here is for informational purposes only. The above quantitative stock analysis, including the Star rating, is mechanically calculated and is based on historical information. The analysis assumes the stock will perform in the future as it has in the past. This is generally never true. Before buying or selling any stock you should do your own research and reach your own conclusion. See my Disclaimer for more information.

Full Disclosure: At the time of this writing, I was long in LEG (1.2% of my Income Portfolio). See a list of all my income holdings here.


Recent Stock Analyses:

This article was written by Dividends4Life. If you enjoyed this article, please vote for it by clicking the Buzz Up! button below. [RSS] [Email] [Twitter]


Continue Reading »

Weekend Reading Links - March 14, 2010

For your weekend reading pleasure, the articles listed below contain some of the best dividend and value investing insights found on the web. They were written by various members of the Dividend Investing and Value Network over the past week:

Articles From DIV-Net Members

There are some really good articles here, please take time and read a few of them.


Continue Reading »

Abbott Laboratories (ABT) Stock Analysis

Abbott Laboratories engages in the discovery, development, manufacture, and sale of health care products worldwide. It operates in four segments: Pharmaceutical Products, Diagnostic Products, Nutritional Products, and Vascular Products. The company is a component of the S&P 500 and the dividend aristocrat indexes. Abbott Laboratories has increased dividends for 38 years in a row. Most recently Abbott raised its quarterly dividend payment by 10% to $0.44/share. Dividend author Dave Van Knapp has included the company in his most recent book "The Top 40 Dividend Stocks for 2010".


For the past decade this dividend stock has delivered a total return of 7.3% annually.

At the same time the company has managed to increase earnings per share by 8.40% on average since the year 2000. For fiscal years 2010 and 2011, analysts expect EPS to increase to $4.24 and $4.77. This would be a nice increase from the $3.69 in earnings per share that the company booked for FY 2009. Analysts also expect an over 7% increase in sales for FY 2010 to 33 billion dollars, excluding the recently completed acquisition of Belgium based Solvay’s pharmaceuticals unit. This deal would add $0.10/share in FY 2010 and $0.20/share in FY 2011. I like the strong product pipeline of Abbott, as well as the potential for new launches. There could be some generic competition for some of Abbott’s products but overall the forecast for future revenue increases is quite rosy. Last year’s acquisition of Advanced Medical Optics exposes the company in the rapidly growing market for LASIK and Cataract procedures.
The company also delivers a little over half of its sales from international markets. Almost 18% of its sales come from the drug Humira, which treats rheumatoid arthritis and psoriatic arthritis. This drug is expected to continue delivering strong sales growth in the next few years for Abbott Labs. In June 2009, a federal jury has returned a verdict of $1.67 billion against Abbott Laboratories in a patent infringement suit. The other party to the suit was Johnson & Johnson (JNJ). Abbott Labs (ABT) is currently appealing the verdict.


The ROE has largely remained between 12% and 28% after falling from its 2000 highs over 34%.

The company has managed to increase its annual dividend by 8.60% on average over the past decade. A 9% increase in dividends translates into the dividend payment doubling every 8 years. Since 1986 Abbott Laboratories has managed to double its dividend every 6 years on average.

The dividend payout ratio has largely remained above 50% over the past decade, with spikes in 2001 and 2006 caused by lower earnings. A lower payout is always a plus, since it leaves room for consistent dividend growth minimizing the impact of short-term fluctuations in earnings. Currently the dividend payout ratio is below 50%.

Overall Abbott Laboratories (ABT) is attractively valued currently, trading at a P/E of 15, dividend yield of 3.20% and an adequately covered dividend. While I don't expect to earn as much as this early Abbott Labs (ABT) investor, I still believe that there is room for substantial total returns in this position. I would consider be adding to this position.

Full Disclosure: Long ABT

Relevant Articles:

- Four notable dividend increases
- Dividend Growth beats Dividend Yield in the long run
- Dividends Stocks versus Fixed Income
- Not all dividend stocks are overvalued

This article was written by Dividend Growth Investor. If you enjoyed this article, please vote for it by clicking the Buzz Up! button below.


Continue Reading »

Calibration

In a previous post, we saw how humans have an overconfidence bias, and how that can play havoc on financial forecast estimations. What is not immediately clear, however, is the increasing role overconfidence plays the more knowledge one acquires. That is, as expertise rises, so does overconfidence, resulting in the fact that the people with the most knowledge are likely to be the most miscalibrated, which can result in detrimental effects.


But knowledge alone does not doom someone into being overconfident. James Montier argues that it's a lack of feedback that pushes people to be overconfident. To demonstrate this, Montier cites a study performed by Scott Plous that compares the calibration of weathermen against that of doctors. Weathermen were asked to predict the weather, while doctors were asked to diagnose patients (based on case notes). Both were asked to provide confidence intervals, so that their calibrations could be measured.

Interestingly, weatherman were well calibrated, while doctors were very poorly calibrated. Montier argues that this is because weather forecasters benefit from the fact that they receive immediate evidence of their abilities as forecasters, while doctors do not.

While one may be inclined to believe that financial analysts should be like weathermen in that they can see whether their forecasts came true, similar calibration tests appear to show that analysts are calibrated to a similar extent as doctors! As a result, the industry is glowing with overconfidence. Further testing confirmed the opening hypothesis: experts in finance are more overconfident than lay people, as they apply too narrow a band around their estimates as compared to the general public.

This article was written by Saj Karsan of Barel Karsan. If you enjoyed this article, please vote for it by clicking the Buzz Up! button below.


Continue Reading »

Stock Analysis: Meridian Bioscience Inc. (VIVO)

Linked here is a detailed quantitative analysis of Meridian Bioscience Inc. (VIVO). Below are some highlights from the above linked analysis:

Company Description: Meridian Bioscience Inc. develops, makes and sells disposable diagnostic test kits and related products used for the rapid diagnosis of infectious diseases.

Fair Value: I consider four calculations of fair value, see page 2 of the linked PDF for a detailed description:

  1. Avg. High Yield Price
  2. 20-Year DCF Price
  3. Avg. P/E Price
  4. Graham Number
VIVO is trading at a discount to only 3.) above. The stock is trading at a 28.8% premium to its calculated fair value of $17.94. VIVO did not earn any Stars in this section.

Dividend Analytical Data: In this section there are three possible Stars and three key metrics, see page 2 of the linked PDF for a detailed description:
  1. Free Cash Flow Payout
  2. Debt To Total Capital
  3. Key Metrics
  4. Dividend Growth Rate
  5. Years of Div. Growth
  6. Rolling 4-yr Div. > 15%
VIVO earned two Stars in this section for 2.) and 3.) above. The stock earned a Star as a result of its most recent Debt to Total Capital being less than 45%. VIVO earned a Star for having an acceptable score in at least two of the four Key Metrics measured. Rolling 4-yr Div. > 15% means that dividends grew on average in excess of 15% for each consecutive 4 year period over the last 10 years (2000-2003, 2001-2004, 2002-2005, etc.) I consider this a key metric since dividends will double every 5 years if they grow by 15%. The company has paid a cash dividend to shareholders every year since 1990 and has increased its dividend payments for 19 consecutive years.

Dividend Income vs. MMA: Why would you assume the equity risk and invest in a dividend stock if you could earn a better return in a much less risky money market account (MMA)? This section compares the earning ability of this stock with a high yield MMA. Two items are considered in this section, see page 2 of the linked PDF for a detailed description:
  1. NPV MMA Diff.
  2. Years to > MMA
VIVO earned a Star in this section for its NPV MMA Diff. of the $6,457. This amount is in excess of the $1,600 target I look for in a stock that has increased dividends as long as VIVO. If VIVO grows its dividend at 15.0% per year, it will take 3 years to equal a MMA yielding an estimated 20-year average rate of 3.98%. VIVO earned a check for the Key Metric 'Years to >MMA' since its 3 years is less than the 5 year target.

Other: VIVO is a member of the Broad Dividend Achievers™ Index.

Conclusion: VIVO did not earn any Stars in the Fair Value section, earned two Stars in the Dividend Analytical Data section and earned one Star in the Dividend Income vs. MMA section for a total of three Stars. This quantitatively ranks VIVO as a 3 Star-Hold.

Using my D4L-PreScreen.xls model, I determined the share price would need to increase to $38.46 before VIVO's NPV MMA Differential decreased to the $1,600 minimum that I look for in a stock with 19 years of consecutive dividend increases. At that price the stock would yield 1.77%.

Resetting the D4L-PreScreen.xls model and solving for the dividend growth rate needed to generate the target $1,600 NPV MMA Differential, the calculated rate is 10.4%. This dividend growth rate is less than the 15.0% used in this analysis, thus providing a margin of safety. VIVO has a risk rating of 2.00 which classifies it as a medium risk stock.

VIVO is an integrated life science company that manufactures, markets and distributes a broad range of innovative diagnostic test kits, purified reagents and related products. These products provide for early diagnosis of common medical conditions, such as gastrointestinal, viral, urinary and respiratory infections. VIVO's diagnostic products are used outside of the human body and require little or no special equipment. The company has strong market positions in the areas of gastrointestinal and upper respiratory infections, serology, parasitology and fungal disease diagnosis. VIVO markets its products to hospitals, reference laboratories, research centers, veterinary testing centers, physician offices and diagnostics manufacturers in more than 60 countries around the world. Although the stock is currently trading above my $17.94 fair value price, I view it as a company with a lot of potential; thus I have added it to my watch list. For additional information, including the stock's dividend history, please refer to its data page.

Disclaimer: Material presented here is for informational purposes only. The above quantitative stock analysis, including the Star rating, is mechanically calculated and is based on historical information. The analysis assumes the stock will perform in the future as it has in the past. This is generally never true. Before buying or selling any stock you should do your own research and reach your own conclusion. See my Disclaimer for more information.

Full Disclosure: At the time of this writing, I held no position in VIVO (0.0% of my Income Portfolio). See a list of all my income holdings here.


Recent Stock Analyses:

This article was written by Dividends4Life. If you enjoyed this article, please vote for it by clicking the Buzz Up! button below. [RSS] [Email] [Twitter]


Continue Reading »

Weekend Reading Links - March 7, 2010

For your weekend reading pleasure, the articles listed below contain some of the best dividend and value investing insights found on the web. They were written by various members of the Dividend Investing and Value Network over the past week:

Articles From DIV-Net Members

There are some really good articles here, please take time and read a few of them.


Continue Reading »

Is now the time to start looking at US ETF REITs?

Every industry faces periods of rise and periods of decay. The last few years have, not surprisingly, been a period of decay in the REIT Area. But like nuclear stocks after 3 mile island, or banks after the savings and loan scandle, or bonds after the junk bond era, after a sector has been desimated what is often left are the high quality well managed companies that will rise to dominate the sector in the future. Is now the time for REITs?

For those not familiar with REITs they are otherwise known as Real estate invest trusts. The basic rule that governs their operations is that they give 90% of all revenues from a period back to shareholders in the form of a dividend. There are three key classes:
  • Equity REITS: Invest in property and gain revenues from collecting rent. 
  • Mortgage REITS: Loan money for mortgages or buy and sell mortgage backed securities.
  • Hybrid REITS: You guessed it, they do both.
I am not a big fan of Mortgage REITs, in my opinion they partake in the buying and selling of paper. Paper that is difficult if not impossible to assess its true value. For those more in the know these types of investments may make sense. I follow Buffett's advise when it comes to these matters, if you can't understand it then don't buy it.

So that leaves us with Equity REITs. These REITs employee people who specialize in real estate industry they understand the simple formula (rent - upkeep) > mortgage. With housing prices depressed all across the US those companies that are still alive in this sector are starting to gather steam and acquire great properties. Regardless of what happens over the next few years people will still need properties to rent. Unless you believe that housing prices have a significant way to fall yet this is certainly an interesting sector to examine.

To further diversify there are several ETFs that deal with REITS if we look at each of these compared with the S&P over a two year and five year periods the industry is quite depressed from its highs.

To be clear I am not advising you date the REIT sector, but if you are looking to diversify your portfolio and hold a stock or ETF for 10 years it might be a good time to look at this sector.

This article was written by buyingvalue. If you enjoyed this article, please vote for it by clicking the Buzz Up! button below.


Continue Reading »

Procter & Gamble Company Stock Analysis

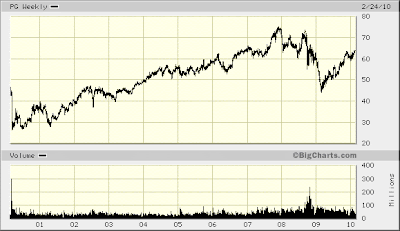
The Procter & Gamble Company engages in the manufacture and sale of consumer goods worldwide. The company operates in three global business units (GBUs): Beauty, Health and Well-Being, and Household Care. This dividend aristocrat has raised distributions for 53 consecutive years.

This dividend stock has delivered an average annual total return of 3.30% over the past decade.

Earnings per share have grown at an average pace of 12.50% per annum. For FY 2010, analysts expect the company to earn $4.15/share, which is higher than 2009’s EPS of $3.58. For FY 2011 analysts expect Procter & Gamble to earn $4.10/share. The company has focused on cost cutting, improving efficiencies and streamlining its product portfolio over the past few years. It sold its Folgers Unit and exited its pharmaceuticals operations. As consumer spending picks up, the company’s recognizable brand products could get a nice boost in sales, especially if it increases advertising. Emerging and developing markets, product innovation, focusing on high margin products as well as strategic acquisitions could deliver strong earnings growth over the next decade. The demand for the company’s line of consumer products is generally stable and not much affected by overall economic conditions. The company continues to benefit from its acquisition of Gillette, through cost synergies and sales growth opportunities from its diverse sales channels.


The annual dividend per share has increased by an average of 11% annually, which is below the growth in earnings. An 11% growth in dividends translates into the payment doubling every almost every six and a half years. Procter & Gamble has managed to double its distributions every seven years on average since 1973.

The return on equity has decreased since the acquisition of Gillette in 2006.

The dividend payout ratio has consistently remained below 50%. A lower payout is always a plus, since it leaves room for consistent dividend growth minimizing the impact of short-term fluctuations in earnings.


I think that Procter & Gamble is attractively valued with its low price/earnings multiple of 15, a not too high DPR. However the current dividend yield is below the 3% minimum threshold that I have set. Two of PG’s competitors, Colgate-Palmolive (CL) and Kimberly-Clark (KMB) trade at P/E multiples of 19 and 13 times earnings respectively. Colgate-Palmolive currently spots a 2.60% dividend yield, while Kimberly-Clark has a 4.00% yield. I would consider adding to my Procter & Gamble holdings on dips below $59.

Full Disclosure: Long PG

Relevant Articles:


- Colgate-Palmolive (CL) Dividend Stock Analysis
- Diageo (DEO) Dividend Stock Analysis

This article was written by Dividend Growth Investor. If you enjoyed this article, please vote for it by clicking the Buzz Up! button below.


Continue Reading »

An Uphill Battle

As previously discussed, value investors can benefit from investing along with other value investors. But the presence of another value investor as a major shareholder does not guarantee that a company will be run in a shareholder-friendly way. Sometimes, management and board practices can make life difficult for even the most active of value investors.


As an example, consider ITEX Corporation (ITEX), which offers a marketplace for businesses to exchange goods and services. ITEX boasts two major value shareholders, including Sardar Biglari and The Polonitza Group, who own a combined 21% of the company. Unfortunately, the company is not currently structured to succeed, with an extremely poor governance structure that tilts the balance of the company's power towards management at the expense of shareholders.

First of all, there are only three board members, one of which is the CEO. Neither of the remaining two board members can reasonably be considered independent, having received compensation from the company in return for consultatory services. Furthermore, there has been no turnover at the director position in almost 8 years! When one of the aforementioned shareholder groups suggested a change at director due to a lack of independence, it appears the company responded that "they are not very close friends and maintain independent thoughts and ideas" and that "they do not frequent each other’s houses or family events". Unfortunately, this hardly assuages shareholder fears, as the issue is not how buddy-buddy these guys are, but how the board's incentives (due to the fact that they provide executive and consulting services to the company) are not aligned with those of shareholders.

As a result, the CEO sits on the audit committee! The other two directors, who receive or have received payment for consulting services from the company, sit on the compensation committee! For all we know, the board is doing a terrific job, but the structure reeks of conflict of interest. But is there any evidence that this might be hurting shareholders?

Well, as these value investors began buying up shares, it appears the board/management went into defensive mode. In 2009, the company protected the CEO from a buyout by guaranteeing some payments to him of a few hundred thousand in the event of a change of control. Furthermore, they recently amended company by-laws that restrict the rights of outside shareholders.

Finally, the company appears rather generous in handing out shares to management, which dilutes existing ownership. The company only has 18 million shares outstanding, but consider the following handouts:

  • In 2001, Mr. White received 250,000 shares for services rendered to ITEX as an independent consultant.
  • For services as a director of ITEX from 2003 through 2007, Mr. White was compensated by an annual grant of 40,000 shares of common stock.
  • For services as a director of ITEX in 2008 and 2009, Mr. White was compensated by an annual grant of 30,000 shares of common stock.
  • On May 3, 2004, and again on July 6, 2006, Mr. White was awarded 300,000 shares of common stock for services rendered ITEX as Chief Executive Officer.
  • On December 13, 2005, Mr. White was awarded 50,000 shares of common stock as consideration for his collateralized personal guarantee of ITEX obligations incurred in order to fund a corporate acquisition.
  • On October 8, 2009, Mr. White was awarded 195,000 shares of restricted common stock for services rendered ITEX as Chief Executive Officer.
Even though value investors may be major shareholders of a corporation, they may still face an uphill battle. Before jumping on board, potential shareholders would be wise to investigate whether management is playing nice, or entrenching themselves.

Disclosure: None

This article was written by Saj Karsan of Barel Karsan. If you enjoyed this article, please vote for it by clicking the Buzz Up! button below.


Continue Reading »

Dividend Advice and Strategy

This is the final week for our video series on common investment topics. The Market Capitalist has a series of videos that we have been linking to here. This week is all about dividends and a dividend strategy.


This article was written by The Dividend Guy. To learn more about dividend investing, please follow my RSS feed or Twitter account.


Continue Reading »