Recent Posts From DIV-Net Members

Stock Analysis: HCC Insurance Holdings Inc. (HCC)

Linked here is a detailed quantitative analysis of HCC Insurance Holdings Inc. (HCC). Below are some highlights from the above linked analysis:

Company Description: HCC Insurance Holdings Inc. is a multi-line insurer that specializes in aviation, marine, medical stop-loss, offshore energy and property and casualty insurance in the U.S. and the U.K.

Fair Value: I consider four calculations of fair value, see page 2 of the linked PDF for a detailed description:

  1. Avg. High Yield Price
  2. 20-Year DCF Price
  3. Avg. P/E Price
  4. Graham Number
HCC is trading at a discount to all four valuations above. The stock is trading at a slight discount to its calculated fair value of $26.41. HCC earned a Star in this section since it is trading at a fair value.

Dividend Analytical Data: In this section there are three possible Stars and three key metrics, see page 2 of the linked PDF for a detailed description:
  1. Free Cash Flow Payout
  2. Debt To Total Capital
  3. Key Metrics
  4. Dividend Growth Rate
  5. Years of Div. Growth
  6. Rolling 4-yr Div. > 15%
HCC earned three Stars in this section for 1.), 2.) and 3.) above. A Star was earned since the Free Cash Flow payout ratio was less than 60% and there were no negative Free Cash Flows over the last 10 years. The stock earned a Star as a result of its most recent Debt to Total Capital being less than 45% and earned a Star for having an acceptable score in at least two of the four Key Metrics measured. Rolling 4-yr Div. > 15% means that dividends grew on average in excess of 15% for each consecutive 4 year period over the last 10 years (1999-2002, 2000-2003, 2001-2004, etc.) I consider this a key metric since dividends will double every 5 years if they grow by 15%. The company has paid a cash dividend to shareholders every year since 1985 and has increased its dividend payments for 13 consecutive years.

Dividend Income vs. MMA: Why would you assume the equity risk and invest in a dividend stock if you could earn a better return in a much less risky money market account (MMA)? This section compares the earning ability of this stock with a high yield MMA. Two items are considered in this section, see page 2 of the linked PDF for a detailed description:
  1. NPV MMA Diff.
  2. Years to > MMA

HCC earned a Star in this section for its NPV MMA Diff. of the $2,387. This amount is in excess of the $2,200 target I look for in a stock that has increased dividends as long as HCC has. If HCC grows its dividend at 15.0% per year, it will take 5 years to equal a MMA yielding an estimated 20-year average rate of 3.72%.

Other: HCC is a member of the Broad Dividend Achievers™ Index.

Conclusion: HCC earned one Star in the Fair Value section, earned three Stars in the Dividend Analytical Data section and earned one Star in the Dividend Income vs. MMA section for a total of five Stars. This quantitatively ranks HCC as a 5 Star-Strong Buy.

Using my D4L-PreScreen.xls model, I determined the share price would need to increase to $26.94 before HCC's NPV MMA Differential decreased to the $2,200 minimum that I look for in a stock with 13 years of consecutive dividend increases. At that price the stock would yield 1.93%.

Resetting the D4L-PreScreen.xls model and solving for the dividend growth rate needed to generate the target $2,200 NPV MMA Differential, the calculated rate is 14.7%. This dividend growth rate is slightly less than the 15.0% used in this analysis, thus providing very little margin of safety. HCC has a risk rating of 1.50 which classifies it as a low risk stock.

HCC uses an opportunistic underwriting approach in which the it waits for other insurers to suffer losses in a particular insurance line. Then the company enters benefiting from their mistakes. Risks of catastrophic events in HCC's aviation and energy businesses increase earnings volatility. Also, as a result of the financial crisis, there is increased risk associated with HCC's directors and officers business. Although, the stock is trading slightly below my buy price of $26.41, its reliance on a high dividend growth rate to achieve its target NPV MMA Diff , along with a dividend yield of less than 2% will keep me on the sidelines for now. For additional information, including the stock's dividend history, please refer to its data page.

Disclaimer: Material presented here is for informational purposes only. The above quantitative stock analysis, including the Star rating, is mechanically calculated and is based on historical information. The analysis assumes the stock will perform in the future as it has in the past. This is generally never true. Before buying or selling any stock you should do your own research and reach your own conclusion. See my Disclaimer for more information.

Full Disclosure: At the time of this writing, I held no position in HCC (0.0% of my Income Portfolio). What are your thoughts on HCC?


Recent Stock Analyses:
This article was written by Dividends4Life. If you enjoyed this article, please vote for it by clicking the Buzz Up! button below.


Continue Reading »

Weekend Reading Links - November 29, 2009

For your weekend reading pleasure, the articles listed below contain some of the best dividend and value investing insights found on the web. They were written by various members of the Dividend Investing and Value Network over the past week:

Articles From DIV-Net Members

There are some really good articles here, please take time and read a few of them.

If you enjoyed this article, please vote for it by clicking the Buzz Up! button below.


Continue Reading »

RSP Home Owner Tax Trick

I don't mind paying taxes but if there is ever an opportunity to pay less I am certainly interested. When my wife and I bought our home we had amassed a nest egg in RSPs. We cashed in the RSP funds as part of the first time home buyer's plan.

This plan allows anyone who has not legally owned a home in the last five years to cash out $20,000 of RSPs for each person on title without enduring the regular taxation hit of withdrawing funds from an RSP- assuming you are willing to refuel your RSP back to its initial value over the course of 15 years. While this is certainly a help if you are coming up short on a down payment, it can also come in handy if you just want a nice tax advantage.

Let me Explain
By cashing out the $20,000 per person you are obliged to refuel your RSP fund to the sum of $1400 per year. Any funds beyond this amount contributed yearly to an RSP can be demarcated as a “new” RSP contribution, or can be routed towards next year's required payment.

So here is where the nice twist comes
After retrieving your first time home buyer's $20K, invest all of the sum immediately back into an RSP. Let me walk you through, When you put the initial $20,000 into your RSP you get a tax advantage as the RSP fund reduces your taxable income. Now you direct the $20,000 for the first time homeowner plan and put it into a new RSP and voila your taxable income goes down again. You have, in effect, had the same $20,000 reduced from your taxable income twice. If you want to double this process again put your spouse on title and you can increase the first time home buyer's to $40K.

As with any tax tip I would suggest you speak with your accountant or financial consultant.

This article was written by buyingvalue. If you enjoyed this article, please vote for it by clicking the Buzz Up! button below.


Continue Reading »

Kinder Morgan Energy Partners (KMP) Dividend Stock Analysis

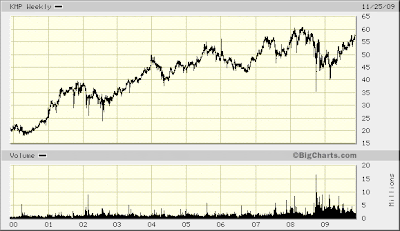
Kinder Morgan Energy Partners, L.P. owns and manages energy transportation and storage assets in North America. Kinder Morgan is a dividend achiever as well as a component of the S&P 500 index. It has increased distributions for the past 13 years. For the past decade this dividend growth stock has delivered annualized total returns of 17.40 % to its shareholders.


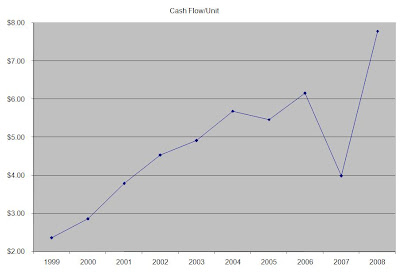
At the same time company has managed to deliver an 14.20% average annual increase in its cash flow per unit since 1999.

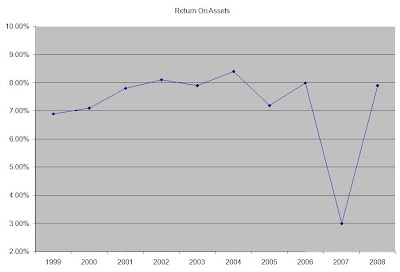
The returns on assets have been very stable between 7% and 8% with the exception of 2007.


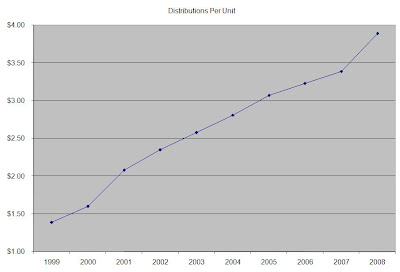
Annual distributions have increased by 12.10% on average over the past 10 years.
A 12% growth in distributions translates into the dividend payment doubling almost every six years. If we look at historical data, going as far back as 1993, we would see that Kinder Morgan has actually managed to double its dividend payment every five years on average.
The company has several projects worth $6 billion in its pipeline, which should add to incremental distributable cash flow per unit over the next few years.

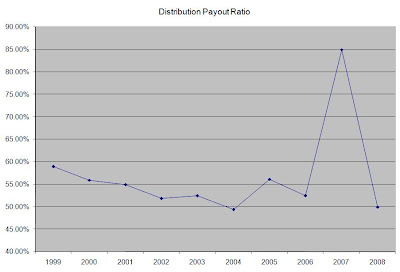
Over the past decade the distribution payout ratio has been rather stable between 50% and 60%. For this company I used the ratio of current cash flow/unit to the annual distribution/unit. A lower payout is always a plus, since it leaves room for consistent dividend growth minimizing the impact of short-term fluctuations in earnings.

The main risks for Kinder Morgan include increase in interest rates, which would increase the company’s borrowing costs to finance future projects and make its units less attractive to investors seeking its fat yield. Another risk could include adverse change in the legal structure of master limited partnerships, similar to what has happened to Canadian Royalty trusts. Thus investors should be careful not to have an overweight exposure to Kinder Morgan and Master Limited Partnerships in their portfolios. In addition to that as a mature MLP, the company distributes 50% of incremental cash flows to the general partner, which is higher in comparison to other pipeline operators.

Overall I think that Kinder Morgan is an attractive option for investors seeking current income as well as for those seeking future distribution growth as well. The company currently yields 7.50% and recently announced that it expects to raise its annual distributions to $4.40/unit from this year’s $4.20/unit. The company does have enough distributable cash flow to cover its distributions, in addition to having a stable toll booth type income streams from its pipeline operations.

There is an easy way to invest in Kinder Morgan (KMP) if you do not want to worry about K-1 tax forms. If you choose KMR they would pay their distributions directly as additional shares, which is similar to automatic dividend reinvestment. If you choose to invest in KMP in an IRA, consider investing in KMR . KMR is a great vehicle for taxable accounts as well since their distributions are not taxable when received, and thus shareholders are not issued an annual 1099 tax form. You would pay taxes only when you sell your units.

Full Disclosure: Long Kinder Morgan Energy

Relevant Articles:

- Master Limited Partnerships (MLPs) – an island of opportunity for dividend investors
- General vs Limited Partners in MLP's
- MLPs for tax-deferred accounts
- Six Dividend Stocks for current income

This article was written by Dividend Growth Investor. If you enjoyed this article, please vote for it by clicking the Buzz Up! button below.


Continue Reading »

Brown and Brown - Stock Analysis for Dividend Growth Portfolio

Brown & Brown, Inc. (BRO) and its subsidiaries, provides insurance and reinsurance products and services, as well as risk management, employee benefit administration and managed health care services. It is a diversified insurance agency and brokerage firm, markets and sells to its customer’s insurance products and services, primarily in the property and casualty area. BRO has operations in 219 locations and in 37 states.

BRO is member of Mergent’s Dividend Achiever Index and S&P Mid-Cap 400 Index. The most recent dividend increase was in October 2009.

Trend Analysis
Here I am looking at trends for past 9 years of company’s revenue and profitability. These parameters should show consistently growth trends. The trend charts and data summary are shown in images below.

  • Revenue: In general, a growing trend since 2000. The average revenue growth for last 9 years has been approximately 13.8%. Year 2009 revenues are expected to be flat.
  • Cash Flows: Overall, until 2008, a growing trend of free cash flow and operating cash flow. FCF is consistently more than net income.
  • EPS from continuing operation: In general, it had an increasing trend until 2007, drop in 2008, and expected to remain flat in 2009.
  • Dividends per share: Very slow anemic albeit growing trend.


Risk Parameter Calculation
Here I use the corporation’s financial health to assign a risk number for measuring risk-to-dividends. The risk number for risk-to-dividends is 1.57. This is a low risk category as per my 3-point risk scale. Other than negative EPS growth in 2008, all other parameters are positive.

Quality of Dividends
This section measures the dividend growth rate, duration of growth, consistency over a period of past five years.

  • Dividend growth rate: The average dividend growth of 18.9% (stdev. 4.81%) is more than average EPS growth rate of 12.3% (stdev. 14.5%).
  • Duration of dividend growth: 16 years of consecutive dividends growth.
  • 4 year rolling dividend growth rate for past ten years: More than 10%.
  • Payout factor: It has been less than 30% since 2001.
  • Dividend cash flow vs. income from MMA: Here, I analyze how the dividend cash flow stacks up against the income from FDIC insured money market account. The baseline assumption is (a) stock is yielding 1.7%; and (b) MMA yield is 2.9%. With my projected dividend growth of 8.2%, the dividend cash flow is 1.41 times the MMA income in 10 years time period. For dividend cash flow to be twice the MMA income, the pricing has to be $14.1 (i.e. yield 2.2%)

Fair Value Calculation
This section determines what price I should pay to buy a given stock

  • Net present value (NPV) price based on 15 year DCF: $20.3
  • Average high yield price calculated based on past 10 years: $24.8
  • Pricing based on past 10 year relative price-to-earnings ratio. $29.5
  • Pricing based on price-to-earnings ratio of 12: $15
  • Graham number: $16.4

The range of fair value is calculated as $18.2 to $21.2.

Qualitative Analysis
BRO is a 70 year old company, and is in top 10 independent insurance intermediaries in US. Its growth model consists of growing market share by acquisition of insurance agencies.

  • Its revenue is pretty much focused in US markets; with approx 70% of revenue is concentrated in 9 states.
  • It continues to have very stable gross and operating margins. It continues to generate relatively stable free cash flows.
  • Being in financial service and insurance industry, I am surprised it does not seem to be affect as other major companies. Perhaps demonstrates its resilience and/or quality of its management taking calculated risk.
  • The risk factor is that other than acquisition mode of growth model, there is not other source of growth.

Conclusion
Brown and Brown Inc is stable and slow growth mid-cap company. It is expected to continue to have a sustainable cash flow over next few years. It is typical dividend growth company where dividends grow in excess of 10%. However, the dividends yields are less than 2%. The stock’s current risk-to-dividend rating is 1.57 (low risk). The current pricing of $18 is within my buy range. I would be open to initiating a position based my allocation levels.

Full Disclosure: No position at the time of this writing. I may buy in near future.

This article was written by Dividend Tree. If you enjoyed this article, please vote for it by clicking the Buzz Up! button below.


Continue Reading »

Free Advice

Every quarter, public companies are required to release their latest financial results. Along with their results, they hold conference calls and accept questions from the public. As we've discussed before, it's important for investors to listen to these calls to understand the challenges the company faces. Usually, analysts ask management about revenue outlooks for various products, margin expectations, overall strategy and other pertinent questions. Sometimes, however, analysts will feel the need to offer some "free" advice to management.

On a conference call for Build-A-Bear (BBW) last year when the stock price was near its lowest, here's what Mike Smith of Kansas City Capital had to say when prompted for his question:

"Well, one comment first before I ask a question. I would suggest you don’t buy any stock back because [insert fearful outlook here]"

His opinion is one which was rampant throughout a finance industry that was gripped with fear. At a time when value investors were buying, stock analysts were against buying back shares at the cheapest prices in over a decade. (Of course, the value of analysts is not so clear when youconsider their ratings of Lehman Brothers the day before it went down).

Of course, when valuations are already high is when companies tend to buy back their stock, with wholehearted support from analysts. Consider the magnitude of the buybacks that took place a couple of years ago when the market was at its peak. Needless to say, it was not the best use of shareholder capital.

I don't necessarily know that BBW should have been buying back stock at that particular point in time, but that option should most certainly not be automatically discarded; if management sees a certain level of cash flow that more than covers the company's fixed obligations, buybacks at cheap prices may very well be in order, particularly for a company with a lot of cash on hand. Here's what BBW's founder, chairman and CEO had to say on the matter:

"We have to look at it week by week and we do. And I think that if there’s opportunities that present themselves because we can see that the cash is in excess of what we thought would need to operate our business in a normal basis. And we’re also trying to look and forecast into 2009 and how the economic issues will affect us there."

Free advice is worth its price!
This article was written by Saj Karsan of Barel Karsan. If you enjoyed this article, please vote for it by clicking the Buzz Up! button below.


Continue Reading »

The Two Sides of Muni Bonds -- Part II

Last time, we talked about what to look for in municipal bonds and their two sides of risk. Now, let's jump right into a few examples.

The safe side

California St. GO Bonds, 2036 4.5% (CUSIP 13062TSB1). These are general obligation of the state of California and pay interest semi-annually at a 4.5% annual rate. As GO bonds, they are backed by the full taxing authority of the state. They're currently trading for around $80 on face value of $100, for a current yield of around 5.6% (4.5%/80=5.6%) and an yield to maturity of about 6%. Just back in July, they traded for $76 and for the last month or two had been trading for $90. Since they're long-term bonds (mature in 2036), the price can fluctuate a lot, based on expectations of inflation, interest rates, and perceived risk.

I found them interesting enough to buy a small amount for $83 back in April. Now at $80, they still seem attractive given the current alternatives.

The risk is that California won't pay its debt. The state is in big trouble, so the risk is real.

The unsafe side

On the dark side, we have revenue bonds whose underlying project went bankrupt.

California Special Tax Diablo Grande, 2014 4.64% (CUSIP 958324CF0). At first glance, this seemed like an interesting opportunity. It's due soon, less than 5 years out, and is currently trading for $62, which means a current yield of over 7% tax-free and an yield to maturity of over 16%.

But consider the risks. These bonds are backed up by a special tax imposed on the Diablo Grande community, a new planned development in California expected to be home to between 5,000 and 10,000 families, businesses, club houses, winery and golf courses. However, due to various legal disputes and the housing downturn, only 400 houses have been built to date. Over 70 of them have been foreclosed. No businesses operate there yet other than the golf courses.

The downside protection is that the state can foreclose on a property that doesn't pay its special taxes. However, there can be no assurance that people won't simply walk away from their devalued properties. If there aren't enough people paying the taxes, the bonds will default.

The developer of the community went bankrupt last year. Recently, a new buyer stepped in and agreed to turn around the operations and re-open the then closed golf courses and club houses. According to local news, the site is operational again, but still there aren't many families and businesses paying the special taxes that support the bonds.

The bonds currently trade for $62 and have been as low as $39 during bankruptcy. The MSRB site does not show any special material events, so I assume the interest is still being paid.

This is one case of high-risk high-reward investment. For the time being, I'm not investing in these bonds until I can confirm how much tax income is available to support the interest on the bonds. A call to the underwriter is in the cards as my next move.

Important note: In investing, there's no such thing as a true safe investment. So, when I classify munis into "safe" and "unsafe", these are both relative terms. It's very possible that "safe" bonds get defaulted on.

Disclosures: I own 13062TSB1 at the time of writing.


This article was written by EPIC INVESTOR. If you enjoyed this article, please vote for it by clicking the Buzz Up! button below.


Continue Reading »
How to Grow Your Retirement Portfolio

As investors, most of us are focused on growing our portfolios so that we can have a comfortable retirement. Easier said than done, but it certainly is not rocket science (never let any mutual fund company or advisor tell you otherwise). There are some simple things you can do as an investor to set yourself up for success.

The video after the jump explains a a very important one - diversification.


This article was written by The Dividend Guy. You may email questions or comments to me at info@thedividendguyblog.com.


Continue Reading »

Stock Analysis: Aflac Incorporated (AFL)

Linked here is a detailed quantitative analysis of Aflac Incorporated (AFL). Below are some highlights from the above linked analysis:

Company Description: Aflac Incorporated engages in the marketing and sale of supplemental health and life insurance plans in the United States and Japan.

Fair Value: I consider four calculations of fair value, see page 2 of the linked PDF for a detailed description:

  1. Avg. High Yield Price
  2. 20-Year DCF Price
  3. Avg. P/E Price
  4. Graham Number
AFL is trading at a discount to 1.) and 3.) above. The stock is trading at a 10.2% premium to its calculated fair value of $40.01. AFL did not earn any Stars in this section.

Dividend Analytical Data: In this section there are three possible Stars and three key metrics, see page 2 of the linked PDF for a detailed description:
  1. Free Cash Flow Payout
  2. Debt To Total Capital
  3. Key Metrics
  4. Dividend Growth Rate
  5. Years of Div. Growth
  6. Rolling 4-yr Div. > 15%
AFL earned three Stars in this section for 1.), 2.) and 3.) above. A Star was earned since the Free Cash Flow payout ratio was less than 60% and there were no negative Free Cash Flows over the last 10 years. AFL earned a Star as a result of its most recent Debt to Total Capital being less than 45% and it earned a Star for having an acceptable score in at least two of the four Key Metrics measured. Rolling 4-yr Div. > 15% means that dividends grew on average in excess of 15% for each consecutive 4 year period over the last 10 years (1999-2002, 2000-2003, 2001-2004, etc.) I consider this a key metric since dividends will double every 5 years if they grow by 15%. The company has paid a cash dividend to shareholders every year since 1973 and has increased its dividend payments for 27 consecutive years.

Dividend Income vs. MMA: Why would you assume the equity risk and invest in a dividend stock if you could earn a better return in a much less risky money market account (MMA)? This section compares the earning ability of this stock with a high yield MMA. Two items are considered in this section, see page 2 of the linked PDF for a detailed description:
  1. NPV MMA Diff.
  2. Years to > MMA

AFL earned a Star in this section for its NPV MMA Diff. of the $7,384. This amount is in excess of the $800 target I look for in a stock that has increased dividends as long as AFL has. If AFL grows its dividend at 16.7% per year, it will take 3 years to equal a MMA yielding an estimated 20-year average rate of 3.9%. AFL earned a check for the Key Metric 'Years to >MMA' since its 3 years is less than the 5 year target.

Other: AFL is a member of the S&P 500, a Dividend Aristocrat and a member of the Broad Dividend Achievers™ Index.

Conclusion: AFL did not earn any Stars in the Fair Value section, earned three Stars in the Dividend Analytical Data section and earned one Star in the Dividend Income vs. MMA section for a total of four Stars. This quantitatively ranks AFL as a 4 Star-Buy.

Using my D4L-PreScreen.xls model, I determined the share price would need to increase to $97.73 before AFL's NPV MMA Differential decreased to the $800 minimum that I look for in a stock with 27 years of consecutive dividend increases. At that price the stock would yield 1.15%.

Resetting the D4L-PreScreen.xls model and solving for the dividend growth rate needed to generate the target $800 NPV MMA Differential, the calculated rate is 9.5%. This dividend growth rate is significantly less than the 16.7% used in this analysis, thus providing a margin of safety. AFL has a risk rating of 1.25 which classifies it as a low risk stock.

Operating in the the U.S. and Japan, two largest insurance markets in the world, AFL has built a tremendous low-cost distribution system. AFL has long been one of my favorite financial stocks. Its debt and cash flow positions are excellent. With revenues, cash flow and dividends rising, AFL is an attractive company. However, it is currently trading at a 10% to my buy price of $40.01. Before adding to my position, I will wait for its price to drop closer to my buy price. For additional information, including the stock's dividend history, please refer to its data page.

Disclaimer: Material presented here is for informational purposes only. The above quantitative stock analysis, including the Star rating, is mechanically calculated and is based on historical information. The analysis assumes the stock will perform in the future as it has in the past. This is generally never true. Before buying or selling any stock you should do your own research and reach your own conclusion. See my Disclaimer for more information.

Full Disclosure: At the time of this writing, I was long in AFL (1.7% of my Income Portfolio). What are your thoughts on AFL?


Recent Stock Analyses:
This article was written by Dividends4Life. If you enjoyed this article, please vote for it by clicking the Buzz Up! button below.


Continue Reading »
Weekend Reading Links - November 22, 2009

For your weekend reading pleasure, the articles listed below contain some of the best dividend and value investing insights found on the web. They were written by various members of the Dividend Investing and Value Network over the past week:

Articles From DIV-Net Members

There are some really good articles here, please take time and read a few of them.

If you enjoyed this article, please vote for it by clicking the Buzz Up! button below.


Continue Reading »
Investing in Private and Public Companies

From time to time I am asked if I would like to invest in someone's private business. Usually the answer is no. The startling percentage of small businesses that fail creates an unacceptable imbalanced between risk and reward. Every once in a while though I am intrigued by the idea and will go on to request a look at the company's financial statements.


There is an important lesson I have learned though from looking at these private company documents. This lesson extends beyond private companies to investing in general. Private and public companies have very different intents, and as such will use all of the legal leniency in their financial statements to achieve these intents.


Private companies will focus all of their might at keeping taxable income down. Public companies have exactly the opposite intent, show investors consistent growth in income.


There are a wealth of perfectly legal ways for either public or private companies to achieve these means. I certainly don't mean to make it sound malicious- it is just businesses. As a result you as an investor should take a Socratic approach to analyzing all financial statements- question everything. Ask the questions where does the money come from, where does it go, and if you don't like the answers keep digging.


I had the opportunity to watch a bit of Michael Moore's recent movie about Capitalism. There was one startling scene in which Michael asked people on wall street to define derivatives. The people he asked bumbled and sputtered and where unable to really explain it with any vigor and yet were likely buying these very financial vehicles. While I accept Michael has an agenda, the whole thing reminds me that you as an investor have a responsibility to dig deep before investing a dollar in any venture. The picture is rarely as clear as it is painted.


This article was written by buyingvalue. If you enjoyed this article, please vote for it by clicking the Buzz Up! button below.


Continue Reading »
When to break your rules

As a dividend growth investor, my strategy is picking the right stocks that provide a decent balance between dividend yield and distribution growth. Thus I have maintained a rigid requirement for a 3% initial yield before investing in a dividend growth company’s securities.
Most dividend investors look for yield when purchasing income securities. Most dividend growth investors purchase securities so that they could enjoy a rising stream of dividend payments over time. Thus, maintaining a proper balance could be a challenge that could make or break your portfolio.

I realize that using a strict yield criteria I could miss out on potential dividend growth stories such as Wal-Mart (WMT) for example. Wal-Mart has never yielded 3% since it went public in the 1970s. The 29.1% annual dividend growth since 1975 has been truly spectacular however. This means that Wal-Mart’s dividend has doubled every 2.5 years for 34 consecutive years. Wal-Mart has delivered a 23.40% dividend growth since 1985 and a 20.20% dividend growth since 1995. Check my analysis of Wal-Mart.

My rationale behind selecting a minimum yield is to provide me with an adequate margin of safety should the stock stop raising dividends and should the stock price fall or remain flat for a large period of time. In the case of Wal-Mart, the stock has been trading in a range over the past decade. Back in 1999 the stock fluctuated between $70.25 and $38.68 and closed at $69.12. The stock wasn’t yielding much back then – about 0.30%. Even if the dividend were doubling every 2.5 years, it would take a retiree almost 13 years in order to reach a yield on cost of 10%. At the current dividend rate, the stock is actually yielding 1.60% on cost, assuming that you purchased it on the last day of 1999. The actual dividend growth over the past decade comes down to 20.80% per annum, which translates into the dividend payment actually doubling every three and a half years.

Now the down side to my having a strict initial yield requirement for entry is that I would miss out on some huge gains, which could lead to early financial freedom. If one had purchased Wal-Mart stock at the end of 1984, the tenth year in a row in which it increased its dividends, their entry price would have been $1.18 (adjusted for five stock splits) and their initial yield would have been only 0.55% at the time. Fast-forward 25 years and the yield on cost comes out to almost 100%.

Many dividend growth investors tend to project past dividend growth rates into infinity, which seems unsustainable to me. If a company with $1 billion in profits enjoyed a 15% annual growth forever, it would double its net income almost every five years. In reality, as the companies grow larger they would find less opportunities that could sustainably earn them higher incremental returns on investment. For example, with a company like McDonald’s (MCD) people could only eat so much burgers and fries. After a company hits a plateau, EPS growth could largely be sustained by increasing efficiencies, raising prices, repurchasing shares or buying other competitors.

This analysis is not meant to be used as a weapon against Wal-Mart or McDonald’s, which are fine companies. It just goes to show that once shouldn’t solely rely on past data in their investment decisions. Furthermore, projecting past data into the future, without adding a what if analysis of your common sense could prove costly in the long run. In addition, purchasing stocks solely for the dividend growth is as dangerous as chasing high yielding stocks blindly.

As far as my strategy is concerned, I am considering lowering the entry yield criteria to 2% for stocks, which appear to have a sustainable above average dividend growth ahead of them. My target allocation for such stocks would be half of what I would normally allocate to such dividend growth champions such as Johnson & Johnson (JNJ) or Procter & Gamble (PG) however.

Full Disclosure: Long JNJ, MCD, PG and WMT

Relevant Articles:


This article was written by Dividend Growth Investor. If you enjoyed this article, please vote for it by clicking the Buzz Up! button below.


Continue Reading »
Case of Dividend Growth in Emerging Economies

The list of dividend aristocrats, dividend achievers, or dividend champion is favorite hunting ground most of the dividend focused investors. This list includes companies from S&P500 index or S&P1500 index that have been continuously raising dividends last 25 years or 10 years or more. In general, these are companies that are listed on US markets. The list of companies (and dividend opportunities) will keep churning. It is really difficult to predict which ones will continue to survive for another 10 years or more. As they age, it will be harder for them to sustain their dividend growth momentum. The likelihood of their ability to grow dividend will continue to diminish.

We need to understand dividend growth in the context of growth in US economy. Dividend growth is only possible on the back of growth in corporate earnings. Keeping with the growth of US economy, many of these companies also continued to grow and hence dividends kept increasing. However, investors cannot ignore the current US economy vis-à-vis emerging market economies.

The chart below shows earnings trends (published on Business Week) for US companies from 1948 to mid 2009. Over the last sixty years, the percentage of profits from foreign operations keeps increasing. In year 2009, these earnings have reached up to 25% of the total profits.

For now, this 25% of total profits may appear as not a significant level, but it is the trend (or growth) that we need to keep in our focus. In addition, there are quite a few US multinationals that are doing well and positioned to continue their growth in developed economies and emerging economies. While the chart above shows overall profits of US companies, following are few dividend companies that generate revenues (and hence earnings) from emerging markets. Majority these companies have paid growing dividends in last five years as measured in their native currency.

  • Proctor and Gamble (35%)
  • Unilever (30%)
  • Johnson and Johnson (60%)
  • Qualcomm Inc. (60%)
  • Intel Corporation (50%)
  • International Business Machines (45%)
  • Microsoft Corporation (33%)
  • ABB (27%)
  • The Coca Cola Company (60%)
  • Pepsico Inc. (50%)
  • Cadbury PLC (24%)
  • Nestle (26%)
  • Siemens AG (23%)
  • Vodaphone PLC (20%)
  • Exxon Mobil Corporation (60%)

It is for this reason I view these multinational companies are potential opportunities for divined growth, hedge against dollar fluctuations, and proxy for emerging markets. Investors can expect companies on this list to provide dividends for relatively longer term.


This article was written by Dividend Tree. If you enjoyed this article, please vote for it by clicking the Buzz Up! button below.


Continue Reading »

The Preferred Treatment

When lending standards toughen, companies work to improve their liquidity positions. One of the easiest ways to improve liquidity is by cutting dividend payments: unlike cutting marketing or research expenses, a company doesn't hurt its operations by saving money by way of stopping its dividend.

However, preferred stock dividends are often cumulative, meaning if payments are put on hold, they must eventually be paid out before common stockholders receive a dime. As such, it is important for investors of common stock to take into consideration the value of cumulative dividends owed. These will not show up as liabilities on the balance sheet, but for common stockholders they most certainly are liabilities! Therefore, they must be manually subtracted from an investor's valuation of a company, along with the value of the preferred shares themselves.

On the flip side, this represents an opportunity for investors willing to foray into the preferred stock space. As discussed in this chapter of Security Analysis, some healthy companies act conservatively and do not pay out preferred dividends for years at a time. As such, they have cumulative dividends owing. When the company is ready to pay common stockholders, these cumulative dividends in arrears have to be paid out first, to the current holders of the preferred shares. Therefore, purchasing preferred shares where large cumulative dividends are owed can represent great upside if the company's financials are sound.

This article was written by Saj Karsan of Barel Karsan. If you enjoyed this article, please vote for it by clicking the Buzz Up! button below.


Continue Reading »

Investment Fee Creep

I used to own a mutual fund that kept performing worse and worse as time went on. This was in the early days when I investing in high fee mutual funds because I did not know any better. Today I know better. One thing that I saw with a couple of funds I owned was something I called "fee creep".

Fee creep is a real simple concept. In essence, it is when a mutual fund slowly and quietly increases its management expense ratios over time. For example, assume that a mutual fund started with an MER when you bought it of 1.50%. Shoot forward three years and you notice that the MER on that same fund is 1.52%. That may not seem like much - it is an extra $2 on a $10,000 investment. However, when you compound that over a period of 25 years it can become very substantial.

The solution? Simple. The first thing you can do is keep your fees low to start with and then you will not need to worry about it too much. The second thing is to review your fund's MER from time to time to see what is happening with them. If they have gone up, then ensure that your returns have also been going up. If your returns are down in that fund and the fees are still higher then move your money elsewhere. These days, there is enough competition that mutual fund fees should be going down. Do not settle for rising fees if performance does not improve.

This article was written by The Dividend Guy. You may email questions or comments to me at info@thedividendguyblog.com.


Continue Reading »

Stock Analysis: Community Trust Bank Corp. (CTBI)

Linked here is a detailed quantitative analysis of Community Trust Bank Corp. (CTBI). Below are some highlights from the above linked analysis:

Company Description: Community Trust Bank Corp. owns and operates Community Trust Bank, Inc. of Pikeville, KY, which provides commercial banking services in Kentucky and West Virginia; and a trust company.

Fair Value: I consider four calculations of fair value, see page 2 of the linked PDF for a detailed description:

  1. Avg. High Yield Price
  2. 20-Year DCF Price
  3. Avg. P/E Price
  4. Graham Number
CTBI is trading at a discount to 1.), 3.) and 4.) above. The stock is trading at a 6.2% discount to its calculated fair value of $24.99. CTBI earned a Star in this section since it is trading at a fair value.

Dividend Analytical Data: In this section there are three possible Stars and three key metrics, see page 2 of the linked PDF for a detailed description:
  1. Free Cash Flow Payout
  2. Debt To Total Capital
  3. Key Metrics
  4. Dividend Growth Rate
  5. Years of Div. Growth
  6. Rolling 4-yr Div. > 15%
CTBI earned three Stars in this section for 1.), 2.) and 3.) above. A Star was earned since the Free Cash Flow payout ratio was less than 60% and there were no negative Free Cash Flows over the last 10 years, and another Star was earned as a result of its most recent Debt to Total Capital being less than 45%. The stock earned a Star for having an acceptable score in at least two of the four Key Metrics measured. The company has paid a cash dividend to shareholders every year since 1950 and has increased its dividend payments for 29 consecutive years.

Dividend Income vs. MMA: Why would you assume the equity risk and invest in a dividend stock if you could earn a better return in a much less risky money market account (MMA)? This section compares the earning ability of this stock with a high yield MMA. Two items are considered in this section, see page 2 of the linked PDF for a detailed description:
  1. NPV MMA Diff.
  2. Years to > MMA
CTBI earned a Star in this section for its NPV MMA Diff. of the $830. This amount is in excess of the $600 target I look for in a stock that has increased dividends as long as CTBI has. The stock's current yield of 5.12% exceeds the 3.9% estimated 20-year average MMA rate.

Other: CTBI is a member of the Broad Dividend Achievers™ Index.

Conclusion: CTBI earned one Star in the Fair Value section, earned three Stars in the Dividend Analytical Data section and earned one Star in the Dividend Income vs. MMA section for a total of five Stars. This quantitatively ranks CTBI as a 5 Star-Strong Buy.

Using my D4L-PreScreen.xls model, I determined the share price would need to increase to $25.85 before CTBI's NPV MMA Differential decreased to the $600 that I like to see for a stock with 29 years of consecutive dividend increases. At that price the stock would yield 4.64%.

Resetting the D4L-PreScreen.xls model and solving for the dividend growth rate needed to generate the target $600 NPV MMA Differential, the calculated rate is 1.5%. This dividend growth rate is less than the 2.6% used in this analysis, thus providing a margin of safety. CTBI has a risk rating of 1.25 which classifies it as a low risk stock.

CTBI is an interesting stock. Its debt position and cash flow are excellent. Though revenue and earnings were down in 2008, free cash flow was up. On a trailing twelve month basis most metrics have improved since 2008. Although the stock is trading below my buy price of $24.99, I will wait for CTBI's next dividend increase (scheduled for December) before deciding to buy or not. For additional information, including the stock's dividend history, please refer to its data page.

Disclaimer: Material presented here is for informational purposes only. The above quantitative stock analysis, including the Star rating, is mechanically calculated and is based on historical information. The analysis assumes the stock will perform in the future as it has in the past. This is generally never true. Before buying or selling any stock you should do your own research and reach your own conclusion. See my Disclaimer for more information.

Full Disclosure: At the time of this writing, I held no position in CTBI (0.0% of my Income Portfolio). What are your thoughts on CTBI?


Recent Stock Analyses:
This article was written by Dividends4Life. If you enjoyed this article, please vote for it by clicking the Buzz Up! button below.


Continue Reading »

Weekend Reading Links - November 15, 2009

For your weekend reading pleasure, the articles listed below contain some of the best dividend and value investing insights found on the web. They were written by various members of the Dividend Investing and Value Network over the past week:

Articles From DIV-Net Members

There are some really good articles here, please take time and read a few of them.

If you enjoyed this article, please vote for it by clicking the Buzz Up! button below.


Continue Reading »

Housing as the Great Investment

I am always surprised to see the enthusiasm people exhibit when they hear that housing prices are rising, to me this is 100% bad news.
I hear remarks all the time like,

Housing prices are up 12% over last year, I am going to make a killing on this house when I sell in a year or two!
Let's say you buy a house as a primary residence at $300K and are fortunate enough to see a 12% compound increase in the price of the house for 3 years in a row. So that makes the value of your house now an impressive $421K- wow $121K nice return, well worth celebration.

But wait, are you going to live in a paper box now? The average North American's needs/desires grow instead of shrinking, very few will voluntarily downsize in the purchase of their next home. So at the end of the three years shopping for a bigger home is the next logical step.

Most consumers have bought the $300K house not because they believe it will always meet their needs, but more because they couldn't raise that extra $100K to afford that $400K house. So what happened to that $400K dream house over this same period? Well now that $400K house has risen at the same impressive 12% and is up for sale for $562K. Unfortunately this leads to a rather undesirable circumstance; while you were $100K off of your dream home three years ago, you are now $140K off today- and this doesn't take into account the 3% or more you will end up paying a real estate agent and the monies required to pay the government and lawyers offices.
Now for the few out there that are multi home owners, or who plan to downsize this isn't a problem, sell a home, bank the difference, and invest in another small home. For the majority of people though housing price increases are just bad news. The only one that really wins at the end of the day is the bank; as you will now require a larger loan to finance your $562K dream house.

I have painted a very specific circumstance here, but I feel that it is one that represents the average North American. They live in a house that is their primary residence, and they are not currently living in the house of their dreams. For this individual an increase in housing prices is hardly worth celebrating.

I would recommend instead hoping that prices get frozen, it benefits everyone except those at the top of the chain and those with multiple homes. It makes home entry points fixed and allows a house to function as an advanced saving mechanism. But that is just what I think, what do you think?

This article was written by buyingvalue. If you enjoyed this article, please vote for it by clicking the Buzz Up! button below.


Continue Reading »

Consolidated Edison (ED) Stock Analysis

Consolidated Edison, Inc. (ED), through its subsidiaries, provides electric, gas, and steam utility services in the United States. It provides electric service to approximately 3.3 million customers and gas service to approximately 1.1 million customers in New York City and Westchester County, as well as provides steam service to office buildings, apartment houses, and hospitals in parts of Manhattan.


Consolidated Edison is a dividend aristocrat as well as a component of the S&P 500 index. It has been increasing its dividends for the past 35 consecutive years. For the past decade this dividend stock has delivered an annual average total return of 6.30 % to its shareholders.


At the same time the company has managed to deliver a 0.80% average annual increase in its EPS since 1999. For the next two years analysts expect EPS to increase to $3.11 and $3.30 respectively. The main problem for utility companies is that they are very capital intensive and are highly regulated. In order for utilities companies to increase rates, they have to seek regulatory approval. In addition to that investing in such projects such as the smart grid is subsidized through federal programs, although companies like Con Ed typically put in at least a portion of the needed amount.


The return on equity has declined slightly over the past decade, although it is at 10% currently.
Annual dividend payments have increased by an average of 1.00% annually over the past 10 years, which is higher than the growth in EPS. The company has increased the amount of the stock outstanding by an average of 2.6% per year over the past decade. Despite the slow dividend growth, the company might be a good pick for investors who are seeking current retirement income.


A 1% growth in dividends translates into the dividend payment doubling almost every 72 years. If we look at historical data, going as far back as 1975, we would see that Con Edison has actually managed to double its dividend payment every eleven years on average. The current dividend payment is double what it was in 1985 however.


Over the past decade the dividend payout ratio has ranged between a low of 57% and a high of 97%. Currently the dividend payout ratio is at 69.6%. While this would be high for a company like McDonald’s (MCD) or Procter & Gamble (PG), a payout ratio of 70% is not uncommon for utilities. Utilities typically pay out a large portion of their earnings as dividends, which explains their slow dividend growth and high dividend yields. Most utilities operate as natural monopolies, which guarantee almost no competition in their specific geographic areas. It would be very costly to run two separate electrical grids, and such investment could take many decades to pay off. Thus utilities tend to generate stable earnings and revenues in any economic conditions, as people keep using water, gas and electricity in their daily lives no matter what.

I believe that Consolidated Edison is attractively valued with its low price/earnings multiple of 14, as well as an above average dividend yield at 5.60%. The high dividend payout should not be a concern because of the industry the company is in. Because of the slow dividend growth of the stock however, I would only invest in it for current income within the next decade. I do own ED mainly for diversification within the utility industry and for a current yield boost to my dividend income.

Disclosure: Long ED
Relevant Articles:


This article was written by Dividend Growth Investor. If you enjoyed this article, please vote for it by clicking the Buzz Up! button below.


Continue Reading »

The Right P/E For The S&P 500

As the market has continued to soar while corporate profits have continued to plummet, many market observers have noted that the P/E level of the S&P 500 has risen to such an extent that an overvalued market is now upon us. Indeed, Standard and Poor's reports a P/E for the S&P 500 of 122, which is clearly above the index's historical range. Does this constitute a clear signal to value investors to stay away? Not on its own.


The problem with this measure of the market's valuation is that, at times, earnings may be temporarily depressed. During recessions, unanticipated drops in revenue occur which catch companies off-guard. Companies cut their costs in reaction to these revenue shocks, but there is a lag. To demonstrate this, consider the following chart depicting the profit margin level of the S&P 500 in the aggregate:

In every recession, profit margins temporarily shrink. Therefore, to justify what appears to be a ridiculously high P/E, we do not presume incredible growth in sales or returns on capital as was the norm in the late 90s. Instead, we consider what the earnings would look like when the write-downs and impairments are complete, and companies have returned to a more normal operating environment.

(As an aside, notice how strong profit margins were in particular during the expansion that preceeded this recession. This could be due to the growth that occurred in the financial industry, where margins tend to be higher as we saw here.)

Based on the above chart, the average margin for the S&P 500 appears to be around 5-6%. Using this number to determine the normalized earnings level of the index gives the S&P 500 a P/E of around 20.

Though this is a more useful calculation of the market's P/E from the perspective of a long-term investor, this still does not suggest the market is cheap. Earnings are determined by multiplying profit margins with sales; with high unemployment and tighter lending standards, the sales level of the index may shrink further from this level, reducing earnings further.

Furthermore, within the index itself, some companies will fare better than others. Many companies will be unable to handle the depressed earnings environment (due to debt or other fixed obligations) and will therefore fail. But companies with flexible cost structures will be able to return to profit margin levels commensurate with their histories, and investors who identify such companies could find themselves with returns that outperform the index.
* Source: Thanks to William Hester of Hussman Funds for the profit margin chart.

This article was written by Saj Karsan of Barel Karsan. If you enjoyed this article, please vote for it by clicking the Buzz Up! button below.


Continue Reading »

Keeping Investing Through Thick and Thin

Ok, perhaps this video is a little late as the "financial crisis" at its worst from a stock market perspective is almost a year behind us. However, this video from John C. Bogle provides lessons for all of us no matter what is happening in the markets. The key message is stay the course and do not let your emotions get in your way!


As always, good advice from Mr. Bogle

This article was written by The Dividend Guy. You may email questions or comments to me at info@thedividendguyblog.com.


Continue Reading »

Stock Analysis: McDonald's Corporation (MCD)

Linked here is a detailed quantitative analysis of McDonald's Corporation (MCD). Below are some highlights from the above linked analysis:

Company Description: McDonald's Corporation is the largest fast-food restaurant company in the world. Its restaurants serve a varied, yet limited, value-priced menu in more than 100 countries around the world.

Fair Value: I consider four calculations of fair value, see page 2 of the linked PDF for a detailed description:

  1. Avg. High Yield Price
  2. 20-Year DCF Price
  3. Avg. P/E Price
  4. Graham Number
MCD is trading at a discount to 1.), 2.) and 3.) above. The stock is trading at a 13.2% discount to its calculated fair value of $71.11. MCD earned a Star in this section since it is trading at a fair value.

Dividend Analytical Data: In this section there are three possible Stars and three key metrics, see page 2 of the linked PDF for a detailed description:
  1. Free Cash Flow Payout
  2. Debt To Total Capital
  3. Key Metrics
  4. Dividend Growth Rate
  5. Years of Div. Growth
  6. Rolling 4-yr Div. > 15%
MCD earned one Star in this section for 3.) above. The stock earned a Star for having an acceptable score in at least two of the four Key Metrics measured. Rolling 4-yr Div. > 15% means that dividends grew on average in excess of 15% for each consecutive 4 year period over the last 10 years (1999-2002, 2000-2003, 2001-2004, etc.) I consider this a key metric since dividends will double every 5 years if they grow by 15%. The company has paid a cash dividend to shareholders every year since 1976 and has increased its dividend payments for 33 consecutive years.

Dividend Income vs. MMA: Why would you assume the equity risk and invest in a dividend stock if you could earn a better return in a much less risky money market account (MMA)? This section compares the earning ability of this stock with a high yield MMA. Two items are considered in this section, see page 2 of the linked PDF for a detailed description:
  1. NPV MMA Diff.
  2. Years to > MMA
MCD earned a Star in this section for its NPV MMA Diff. of the $18,427. This amount is in excess of the $500 target I look for in a stock that has increased dividends as long as MCD has. If MCD grows its dividend at 16.9% per year, it will take 2 years to equal a MMA yielding an estimated 20-year average rate of 3.9%. MCD earned a check for the Key Metric 'Years to >MMA' since its 2 years is less than the 5 year target.

Other: MCD is a member of the S&P 500, a Dividend Aristocrat and a member of the Broad Dividend Achievers™ Index.

Conclusion: MCD earned one Star in the Fair Value section, earned one Star in the Dividend Analytical Data section and earned one Star in the Dividend Income vs. MMA section for a total of three Stars. This quantitatively ranks MCD as a 3 Star-Hold.

Using my D4L-PreScreen.xls model, I determined the share price would need to increase to $209.72 before CRRC's NPV MMA Differential decreased to the $500 that I like to see for a stock with 33 years of consecutive dividend increases. At that price the stock would yield 0.98%.

Resetting the D4L-PreScreen.xls model and solving for the dividend growth rate needed to generate the target $500 NPV MMA Differential, the calculated rate is 5.5%. This dividend growth rate is significantly less than the 16.9% used in this analysis, thus providing a margin of safety. MCD has a risk rating of 1.50 which classifies it as a low risk stock.

MCD is a stock that I have liked for many years. It has shown strong dividend growth over the last 10 years. However, its debt level and free cash flow payout have crept up to levels above what I am comfortable with. Although the stock is trading well below my buy price of $71.11, I will wait for MCD's dividend fundamentals to improve before adding to my position. For additional information, including the stock's dividend history, please refer to its data page.

Disclaimer: Material presented here is for informational purposes only. The above quantitative stock analysis, including the Star rating, is mechanically calculated and is based on historical information. The analysis assumes the stock will perform in the future as it has in the past. This is generally never true. Before buying or selling any stock you should do your own research and reach your own conclusion. See my Disclaimer for more information.

Full Disclosure: At the time of this writing, I was long in MCD (2.8% of my Income Portfolio). What are your thoughts on MCD?

Recent Stock Analyses:
This article was written by Dividends4Life. If you enjoyed this article, please vote for it by clicking the Buzz Up! button below.


Continue Reading »