Recent Posts From DIV-Net Members

Penny Stocks are No More Riskier than GOOG

Penny stocks have a bad rep. It's very similar to how people give motorcycles a bad rep. The reckless shirtless riders ruin it for the rest that ride responsibly and safely. Traders and penny stock pump and dumpers certainly have ruined it for the majority.

Just until about 6 months ago, I steered well clear of penny stocks. I viewed it as risky, gambling and plain evil. But that has changed. I finally got rid of that misconception.

The penny stocks I am referring to are the companies that lie in net net territory, plenty of assets and cash from operations to support the business. These penny stocks have fallen so much in price that there downside is very limited. Take iGo Inc (IGOI) for example, their current share price is $0.62 but it has $0.97 in liquid assets even after subtracting total liabilities. When IGOI announced that their biggest customer accounting for 42% of revenue canceled their contract, how much did the stock fall? It fell 0%. That's right. The stock price did not budge. Quite a contrast to other Wall Street darlings that miss earnings by 1c followed by the stock cratering down 20-30%.

The small and microcap universe is not risky. It is just misunderstood. If you apply the same fundamental analysis, these penny stocks are no more risky than buying any other stock. In fact, buying GOOG at $700 and AMZN at $90 was one of the riskiest things you could have done.

Disclosure

I own shares of IGOI


This article was written by Old School Value. If you enjoyed this article, please vote for it by clicking the Buzz Up! button below.


Continue Reading »

Rocky Road For Rocky Mountain

Many value investors are extolling the virtues of Rocky Mountain Chocolate Factory (RMCF), and with good reason. The stock has a P/E of 8, while the company has almost no debt and has managed to stay profitable throughout this downturn. As noted at Wide Moat Investing, the company has also not been shy to return money to shareholders, with a dividend yield above 7%. But there is one risk that investors would be wise to note: we just don't know that much about this company's financials.

It's not that the company isn't disclosing required information, but the inherent structure of the firm makes it very difficult for investors to determine how well (or how badly!) things are actually going. Ninety-five percent of the company's revenue comes from sales to its franchisees, and the results of these independent entrepreneurs are not consolidated in RMCF's financial statements - but the health of these franchisees does have a direct bearing on the value of RMCF. If franchisees are hemorraging money, the sales (and profits) currently enjoyed by RMCF will come to an abrupt halt.

While we don't have any direct data as to the health of the franchisees, we can take get some clues based on what RMCF has disclosed. Franchisee purchases from RMCF declined by 24% in the last quarter (y/y), meaning franchisee sales have probably declined by a similar amount. If their cost structures are fairly rigid, chances are many of them are losing money. Indeed, since this time last year, 11 domestic stores or kiosks have closed down. However, even though the number of franchisees is down, and the existing franchisees are purchasing significantly less product, RMCF is actually carrying more inventory now than it did at this point last year.

These facts don't necessarily mean that RMCF is not a buy, however, it is very difficult to tell how independent franchisees are faring in this environment. Their sales are clearly down, but do they have the financial strength to stick it out and keep buying product from RMCF, or will more of them start to drop off, propogating their difficulties to RMCF? The answer is too difficult for this investor to determine.

Disclosure: None

This article was written by Saj Karsan of Barel Karsan. If you enjoyed this article, please vote for it by clicking the Buzz Up! button below.


Continue Reading »

Candid Management and Widening Moats

Spring is the season for annual reports, and many executives use the occasion to spin a few tales about business in the year past. Though ostensibly these are letters from management to the boss—that is, the owners—far too many seem to take their storytelling lessons from the habits of evasive, guilty teenagers.On rare occasions one finds an honest, clear assessment of the year's work, and such candor is impossible to miss. For the investor, the spring season is one for assessing the pen of management, in order to discern trustworthy and honest stewards of capital.

Of course, candor from management has almost become an endangered species in recent years. Rittenhouse Rankings Inc. has followed this trend with its annual CEO Candor Scores, and in 2007, found that in shareholder letters "confusing and misleading statements or "dangerous fog," increased 66 percent… up from 39 percent five years ago." Instead of providing an impartial and clear analysis of successes and failures, more and more executives speak their Orwellian language, using "words to describe 'the truth we want to exist,' rather than facts." And the point here is not merely pedantic, for Rittenhouse Rankings argue that "high candor scores and rankings reveal high quality leadership, cohesive corporate cultures, more reliable accounting and superior financial performance."

One CEO known for his candor is Wells Fargo's John Stumpf. In his most recent letter to shareholders, Stumpf makes good on his reputation. Though Wells Fargo acquired Wachovia in one of the largest banking acquisitions in the last year, Stumpf does not trumpet their size, for "where [Wells ranks] in asset size alone is meaningless to us… In fact, to our customers, bigness can be a barrier. I've yet to hear of a customer walking into one of our banks and saying, "I want to bank here because you're so … big!"

For Stumpf, Wells' annual success should be determined by two metrics—revenue v. expenses, and return on equity. Regarding the first, Wells' revenue grew six percent in 2008, while expenses declined one percent—"the best such revenue/expense ratio among our large peers, and the one we consider the best long-term measure of a company's efficiency." And on the second, Wells' return on equity was 4.79 cents for every dollar of shareholder equity, best among their peers for the year. By the numbers, Wells did more with less than the year before, and it had better returns on shareholder capital than peers. Even in a difficult macroeconomic environment, someone had to be the best. For the large American banks, 2008 was the year of Wells.

As an investor, Stumpf's candor is refreshing, but his focus arguably more important. Rather than telling a lengthy and jargon-laden tale of Wells' growth or enigmatic synergies, Stumpf reveals his concentration on managing his owners' capital productively, and optimizing aspects of Wells' business that he can control. Increasing the loan portfolio may not be a productive use of capital: only if it can be done at adequate margins, and without excessive expense. Rather than spinning a grand story of how our economy went wrong, Stumpf keeps his eye on his business and intelligent opportunities for growth in the year ahead. Though these two tasks need not be exclusive, experience shows that too many bankers love to indulge in forecasting and professoring.

In our assessment of economic moats, managerial ability, more than almost any other factor, directly correlates with the width of a business' moat. Like Andrew Grove, the best managers are capable of rebuilding a protective moat with a new product, even as past competitive advantages deteriorate. Like Warren Buffett, the best managers are capable of redirecting the life blood for building moats—capital—to the best castles with the ablest builders. Like John Stumpf, the best managers are capable of concentrating their gaze on matters they can control, and each day use capital a little better than the day before.

Disclosure: I, own persons whose accounts I manage, own shares of Berkshire Hathaway at the time of this writing.

This article was written by Wide Moat Investing. You may email questions or comments to me at widemoatinvesting@gmail.com.


Continue Reading »

Investor or Gambler - that is the question

Investing is very different from gambling. Most people believe that they are investors when in fact they are really gambling. As I was rummaging through old articles that I saved, I was reminded of the difference between investing and gambling from this Canadian Moneysense article. In this article, the author highlights 11 traits that a clinical psychologist in San Francisco deemed as indicators to being a gambler. The thinking is that if you exhibit 5 or more of these you may have a gambling problem, according to his research.


1. You engage in high volume trading,where the "action" is more compelling than the objective of your trade.
2. You are constantly preoccupied with your investments.
3. You need to invest more and more money or increase your leverage to feel excited.
4. You have repeatedly tried to stop or control your market activity and failed.
5. You become restless and irritable when you try to cut down or stop investing.
6. You invest to escape problems, relieve depression, or distract yourself from painful emotions.
7. You sometimes increase your position in an investment after a loss รข€” that is, you chase your losses.
8. You have lied to conceal the extent of your involvement in the market.
9. You have committed illegal acts, such as forgery or fraud, to finance your market activity.
10. You are jeopardizing significant relationships or your job because of excessive involvement in the market.
11. You have relied on others to bail you out when you got into desperate financial situations.

Interesting list - do you exhibit any of these when thinking about your investing?

This article was written by The Dividend Guy. You may email questions or comments to me at info@thedividendguyblog.com.


Continue Reading »
Stock Analysis: Johnson & Johnson (JNJ)

Linked here is a detailed quantitative analysis of Johnson & Johnson (JNJ). Below are some highlights from the above linked analysis:

Company Description: Johnson & Johnson engages in the manufacture and sale of various products in the health care field worldwide.

Fair Value: I consider four calculations of fair value, see page 2 of the linked PDF for a detailed description:

  1. Avg. High Yield Price
  2. 20-Year DCF Price
  3. Avg. P/E Price
  4. Graham Number
JNJ is trading at a discount to 1.), 2.) and 3.) above. If I exclude the high and low valuations and average the remaining two, JNJ is trading at a 18.2% discount. JNJ earned a Star in this section since it is trading at a fair value.

Dividend Analytical Data: In this section I consider five factors, see page 2 of the linked PDF for a detailed description:
  1. Rolling 4-yr Div. > 15%
  2. Dividend Growth Rate
  3. Years of Div. Growth
  4. 1-Yr. > 5-Yr Growth
  5. Payout 15% of avg.
JNJ earned one Star in this section for 3.) above. JNJ has paid a cash dividend to shareholders every year since 1944 and has increased its dividend payments for 47 consecutive years.

Dividend Income vs. MMA: Why would you assume the equity risk and invest in a dividend stock if you could earn a better return in a much less risky money market account (MMA)? This section compares the earning ability of this stock with a high yield MMA. Two items are considered in this section, see page 2 of the linked PDF for a detailed description:
  1. NPV MMA Diff.
  2. Years to > MMA
JNJ earned both of the available Stars in this section. The NPV MMA Diff. of the $9,091 is in excess of the $2,500 minimum I look for in a stock that has increased dividends as long as JNJ has. JNJ's current yield of 3.84% exceeds the 3.17% estimated 20-year average MMA rate.

Other: JNJ is a member of the S&P 500, a Dividend Aristocrat and a member of the Broad Dividend Achievers™ Index. JNJ's products are somewhat immune to the economic cycles. The company is diverse in both its products (drugs, medical devices, and consumer products) and customers. JNJ enjoys competitive advantages in financial resources, business scale and global footprint. In the face of challenging prospects in it drug business, JNJ recently diversified into aesthetics products and biosurgical items. Risks include generic erosion in several drugs, pipeline disappointments and unfavorable foreign exchange rates.

Conclusion: JNJ earned one Star in the Fair Value section, earned one Star in the Dividend Analytical Data section and earned two Stars in the Dividend Income vs. MMA section for a net total of four Stars. This quantitatively ranks JNJ as a 4 Star-Buy.

Using my D4L-PreScreen.xls model, I determined the share price could increase to $62.25 before JNJ's NPV MMA Differential fell to the $3,000 that I like to see. At that price the stock would yield 2.63%.

Resetting the D4L-PreScreen.xls model and solving for the dividend growth rate needed to generate the needed $3,000 NPV MMA Differential, the calculated rate is 2.4%. This dividend growth rate is significantly below the 7.5% used in this analysis, thus providing a margin of safety. JNJ has a risk rating of 1.25 which classifies it as a low risk stock.

JNJ is truly one of the elites dividend stocks and offers everything a dividend investor is looking for to support a steadily increasing dividend - excellent business model, strong balance sheet with low debt and supported by consistent cash flows. I plan to add to my position when JNJ is below by $62.25 buy price. For additional information, including the stock's dividend history, please refer to its data page.

Disclaimer: Material presented here is for informational purposes only. The above quantitative stock analysis, including the Star rating, is mechanically calculated and is based on historical information. The analysis assumes the stock will perform in the future as it has in the past. This is generally never true. Before buying or selling any stock you should do your own research and reach your own conclusion. See my Disclaimer for more information.

Full Disclosure: At the time of this writing, I was long in JNJ (1.7% of my Income Portfolio). What are your thoughts on JNJ?

Recent Stock Analyses:
This article was written by Dividends4Life. If you enjoyed this article, please vote for it by clicking the Buzz Up! button below.


Continue Reading »

Weekend Reading Links - April 26, 2009

For your weekend reading pleasure, the articles listed below contain some of the best dividend and value investing insights found on the web. They were written by various members of the Dividend Investing and Value Network (DIV-Net) over the past week:

Articles From DIV-Net Members

There are some really good articles here, please take time and read a few of them.

If you enjoyed this article, please vote for it by clicking the Buzz Up! button below.


Continue Reading »

Dividend Increases - April 25, 2009

Blue-chip dividend increases continued this week and I anticipate more in the coming weeks. Dividend investors always appreciate seeing their cash dividends increase from low-debt dividend stocks. This week's dividend increases include:

  • Johnson & Johnson (JNJ) announced a 6.5% increase in its quarterly dividend to $0.49/share, Yield: 3.60%
  • Southern Company (SO) raises annual dividend by 4.2% to $1.75/share, Yield: 5.94%
  • Coach (COH) initiates $0.30/share annual dividend, Yield: 1.32%
  • Hudson City Bancorp (HCBK) bumps its quarterly dividend to $0.15/share, Yield: 4.93%
  • J. M. Smucker (SJM) boosts dividend 9.3% to $0.35/share, Yield: 3.65%
To paraphrase John D. Rockefeller, "Do you know the only thing that gives me pleasure? It’s to see my dividends increasing each year." For more companies around the world with a long string of consecutive dividend increases, see my updated Stock Ideas page.

Full Disclosure: Long JNJ

This article was written by Dividends4Life. If you enjoyed this article, please vote for it by clicking the Buzz Up! button below.


Continue Reading »

Chevron Corporation (CVX) Dividend Stock Analysis

Chevron Corporation operates as an integrated energy company worldwide. Chevron Corporation is a component of the S&P 500 and Dow Jones Industrials Indexes. The company is also a dividend achiever, which has been consistently increasing its dividends for 21 consecutive years. From the end of 1998 up until December 2008 this dividend growth stock has delivered an annual average total return of 9.40% to its shareholders.


At the same time company has managed to deliver an impressive 25% average annual increase in its EPS since 1999. The increase in prices of crude oil and natural gas definitely helped with earnings. The rapid fall of energy prices in late 2008 and early 2009 and weak global demand could lead to lower earnings per share in 2009 to $4.70/share according to some analysts. After that expectations are for a recovery in earnings to at least $7/share.
Any analysis of earnings trends for an oil and gas producer such as Chevron would definitely depend of the future prices of energy commodities over the next few years. Nevertheless the dividend is sustainable at current levels and there definitely is some room for dividend growth in 2009 and 2010.

The ROE has consistently remained above 20% since 2003 after earlier volatility in this indicator in the early 2000s.

Annual dividends have increased by an average of 8.30% annually since 1999, which is lower than the growth in EPS. On the other hand however Chevron has been rewarding stockholders with share buybacks as well.
An 8 % growth in dividends translates into the dividend payment doubling almost every nine years. Since 1988 Chevron Corporation has actually managed to double its dividend payment almost every ten years on average.

The dividend payout has largely remained above 50% after 2003. Before that it did shoot up above 50% in 1999, 2000 and 2002. A lower payout is always a plus, since it leaves room for consistent dividend growth minimizing the impact of short-term fluctuations in earnings.

Chevron Corporation is trading at a P/E of 5.60, yields 4.00% and has an adequately covered dividend payment. The forward P/E for 2009 earnings is close to 14. In comparison Exxon Mobil (XOM) trades at a P/E multiple of 8 and yields 2.40%, while British Petroleum (BP) trades at a P/E multiple 5 while yielding 8.40%.
I find Chevron attractively valued at current levels given its stable dividend growth history. If you are looking to add exposure to the energy sector for your dividend portfolio then CVX could just be the right stock for you.

Full Disclosure: Long CVX and XOM

Relevant Articles:

- XOM Dividend Analysis

- Why do I like The Dividend Achievers

- BP (BP) Stock Dividend Analysis

- Best Dividends Stocks for the Long Run


This article was written by Dividend Growth Investor. If you enjoyed this article, please vote for it by clicking the Buzz Up! button below.


Continue Reading »

Take On Taxes

When the returns of various funds, fund managers, or ETFs are bandied about, the discussion is usually centered around pretax rates of return. While this measure makes sense for retirement accounts, pensions, charities and endowments, regular investors have to pay significant taxes on their returns and therefore consideration to tax minimisation must be given.

For these investors, pretax rates of return across funds are not comparable, since investment income can come in many forms including interest, dividends, and capital gains. Complicating matters for investors is the fact that tax rates can vary (sometimes dramatically) across all of these categories, making investment comparisons across categories non-trivial.

Furthermore, tax regimes vary by jurisdiction: while Americans may be subject to lower tax rates on capital gains versus interest income, Colombians face just the opposite situation, with heavy taxes on capital gains and favourable rates on interest income. Knowing the tax regime of your country will help you compare investment possibilities on an after-tax rather than a pretax basis.

For almost all jurisdictions, however, capital gain taxes can be deferred as long as the investment is not sold. The longer this deferral is prolonged (i.e. the longer the investor holds the security), the lower the effective tax rate on the gains becomes. This would seem to suggest that a buy and hold strategy is the most tax efficient, which just happens to be the preferred method of choice for value investors.

However, tax efficiency is no substitute for the value of superior returns: even a highly taxed investment will outperform a poor investment, even if it should be tax-exempt. The point is not to base investment decisions on their tax treatment, but rather to compare investments on an apples-to-apples after-tax basis, and so the reported pretax returns that are the industry norm just don't do the trick.


This article was written by Saj Karsan of Barel Karsan. If you enjoyed this article, please vote for it by clicking the Buzz Up! button below.


Continue Reading »

What a Company Needs to Pay A Dividend Every Year

I was fortunate (or unfortunate depending on your opinion of them) to get a free version of The Motley Fool's new book, The Million Dollar Portfolio. In this book they have a chapter on dividends which lists some qualities that a company must posses in order to pay a dividend consistently year after year. There are four of them according to the authors.


1. Consistent and proven cash earnings power that can grow over time.

2. A stable business in an industry that won't experience massive distributions that could negatively affect dividends.

3. Shareholder-friendly management dedicated to treating shareholders as owners

4. A business model that doesn't require massive amounts of capital outlays relative to its earnings power

I can't really argue with any of these, however I think it is not as cut and dry as it seems. Banks for example were once considered a stable business as was GE - anything can happen and one years stable business can be the next years villain. No matter your criteria for a stable business, it is crucial to ensure you are fully diversified with a strong asset allocation.


This article was written by The Dividend Guy. You may email questions or comments to me at info@thedividendguyblog.com.


Continue Reading »
Stock Analysis: McDonald's Corp. (MCD)

Linked here is a detailed quantitative analysis of McDonald's Corp. (MCD). Below are some highlights from the above linked analysis:

Company Description: McDonald's Corporation is the largest fast-food restaurant company in the world. Its restaurants serve a varied, yet limited, value-priced menu in more than 110 countries around the world.

Fair Value: I consider four calculations of fair value, see page 2 of the linked PDF for a detailed description:

  1. Avg. High Yield Price
  2. 20-Year DCF Price
  3. Avg. P/E Price
  4. Graham Number
MCD is trading at a discount to 1.), 2.) and 3.) above. If I exclude the high and low valuations and average the remaining two, MCD is trading at a 16.7% discount. MCD earned a Star in this section since it is trading at a fair value.

Dividend Analytical Data: In this section I consider five factors, see page 2 of the linked PDF for a detailed description:
  1. Rolling 4-yr Div. > 15%
  2. Dividend Growth Rate
  3. Years of Div. Growth
  4. 1-Yr. > 5-Yr Growth
  5. Payout 15% of avg.
MCD earned three Stars in this section for 1.), 2.) and 3.) above. Rolling 4-yr Div. > 15% means that dividends grew on average in excess of 15% for each consecutive 4 year period over the last 10 years (1999-2002, 2000-2003, 2001-2004, etc.) I consider this a key metric since dividends will double every 5 years if they grow by 15%. MCD has paid a cash dividend to shareholders every year since 1937 and has increased its dividend payments for 32 consecutive years.

Dividend Income vs. MMA: Why would you assume the equity risk and invest in a dividend stock if you could earn a better return in a much less risky money market account (MMA)? This section compares the earning ability of this stock with a high yield MMA. Two items are considered in this section, see page 2 of the linked PDF for a detailed description:
  1. NPV MMA Diff.
  2. Years to > MMA
MCD earned both of the available Stars in this section. The NPV MMA Diff. of the $46,431 is in excess of the $2,500 minimum I look for in a stock that has increased dividends as long as MCD has. MCD's current yield of 3.57% exceeds the 3.17% estimated 20-year average MMA rate. .

Other: MCD is a member of the S&P 500, a Dividend Aristocrat and a member of the Broad Dividend Achievers™ Index. McDonald's competes in the global fast food industry, where it has a very strong international brand. As the global economy continues to slow in 2009, its shares are viewed as a defensive play, with the $2.00/share annual cash dividend as an additional attraction. MCD is recession resistant, but not recession immune. Risks include higher food costs; poor customer acceptance of new menu offerings; competitive discounting; and considering MCD's substantial international business - exchange rate risk.

Conclusion: MCD earned one Star in the Fair Value section, earned three Stars in the Dividend Analytical Data section and earned two Stars in the Dividend Income vs. MMA section for a net total of six Stars. Since my scale tops out at five, this quantitatively ranks MCD as a 5 Star-Strong Buy.

Using my D4L-PreScreen.xls model, I determined the share price could increase to $150.35 before MCD's NPV MMA Differential fell to the $3,000 that I like to see. At that price the stock would yield 1.33%.

Resetting the D4L-PreScreen.xls model and solving for the dividend growth rate needed to generate the needed $3,000 NPV MMA Differential, the calculated rate is 3.5%. This dividend growth rate is significantly below the 15.5% used in this analysis, thus providing a large margin of safety. MCD has a risk rating of 1.75 which classifies it as a medium risk stock.

MCD has done quite well during this economic downturn. It was one of the few blue-chip companies to finish up in 2008. With is most recent double-digit dividend increase, MCD has found a place in most every dividend investor's portfolio. I recently increased my position in MCD to 4% of my income portfolio. For additional information, including the stock's dividend history, please refer to its data page.

Disclaimer: Material presented here is for informational purposes only. The above quantitative stock analysis, including the Star rating, is mechanically calculated and is based on historical information. The analysis assumes the stock will perform in the future as it has in the past. This is generally never true. Before buying or selling any stock you should do your own research and reach your own conclusion. See my Disclaimer for more information.

Full Disclosure: At the time of this writing, I was long in MCD (4.0% of my Income Portfolio).

What are your thoughts on MCD?

Recent Stock Analyses:
This article was written by Dividends4Life. If you enjoyed this article, please vote for it by clicking the Buzz Up! button below.


Continue Reading »

Weekend Reading Links - April 19, 2009

For your weekend reading pleasure, the articles listed below contain some of the best dividend and value investing insights found on the web. They were written by various members of the Dividend Investing and Value Network (DIV-Net) over the past week:

Articles From DIV-Net Members

There are some really good articles here, please take time and read a few of them.

If you enjoyed this article, please vote for it by clicking the Buzz Up! button below.


Continue Reading »

Dividend Increases - April 18, 2009

Dividend increases picked up this week as we head into what is normally a busy period for announcements. Dividend investors always look forward to seeing their cash dividends increase. This week's dividend increases include:

  • Procter & Gamble Company (PG) announced a 10% increase in its quarterly dividend to $0.44/share. Yield: 3.17%
  • Anworth Mortgage Asset Corporation (ANH) increased its quarterly common stock dividend 15.4% to $0.30/share. Yield: 18.18%
  • International Speedway Corporation (ISCA) declared an annual dividend of $0.14/share, an increase of 16.6%. Yield: 0.7%
  • H.B. Fuller (FUL) raised its quarterly dividend by 3% to $0.068/share. Yield: 1.55%
  • Donegal Group (DGICA) boosted its quarterly dividend by 7.1% to $0.1125/share. Yield: 2.72%
  • Southside Bancshares (SBSI) increased its quarterly dividend by 7.1% to $0.1125/share. Yield: 2.55%
The dividend slashers haven't gone away, but the dividend raisers are starting to make their presence known. For more companies around the world with a long string of consecutive dividend increases, see my updated Stock Ideas page.

Full Disclosure: No position in any of the aforementioned securities.

This article was written by Dividends4Life. If you enjoyed this article, please vote for it by clicking the Buzz Up! button below.


Continue Reading »

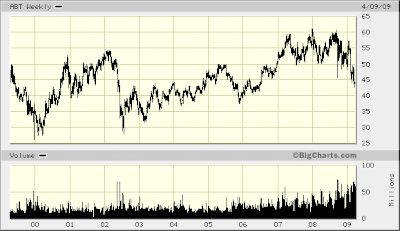
Abbott Labs (ABT) Dividend Stock Analysis

Abbott Laboratories manufactures and sells health care products worldwide.
The companyis a component of the S&P 500 and is a dividend aristocrat, which has been consistently increasing its dividends for 37 consecutive years. Most recently Abbott raised its quarterly dividend payment by 11% to $0.40/share.


From the end of 1998 up until December 2008 this dividend growth stock has delivered an annual average total return of 3.80% to its shareholders.

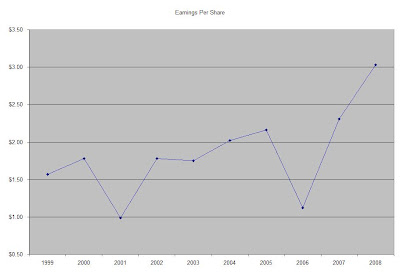
At the same time company has managed to deliver an impressive 7.60% average annual increase in its EPS since 1999. Analysts are estimating an increase in EPS to $3.65 in 2009 and $4.10 by 2010.

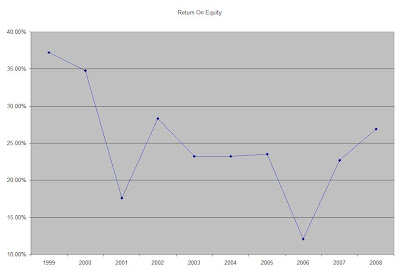
The ROE has largely remained between 12% and 28% after falling from its 1999 highs over 34%.
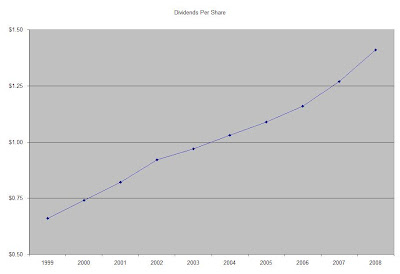
Annual dividends have increased by an average of 8.80% annually since 1999, which is higher than the growth in EPS. A 9 % growth in dividends translates into the dividend payment doubling almost every eight years on average. Since 1986 Abbott Laboratories has actually managed to double its dividend payment almost every six years on average.

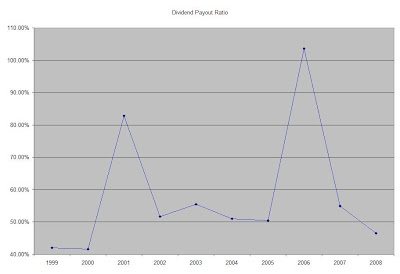
The dividend payout ratio has largely remained above 50% over the past decade, with spikes in 2001 and 2006 caused by lower earnings. A lower payout is always a plus, since it leaves room for consistent dividend growth minimizing the impact of short-term fluctuations in earnings.

Abbott Laboratories is trading at a P/E of 14, yields 3.60% and has an adequately covered dividend payment. In comparison Bristol Myers Squibb (BMY) trades at a P/E multiple of 8 and yields 6.10%, while Johnson and Johnson (JNJ) trades at a P/E multiple 11 while yielding 3.50%.
I like the strong product pipeline of the company, as well as the potential for new launches. There could be some generic competition for some of Abbott’s products but overall the forecast for future revenue increases is quite rosy. The recent acquisition of Advanced Medical Optics exposes the company in the rapidly growing market for LASIK and Cataract procedures. I am considering initiating a position in Abbott on dips.

Full Disclosure: None

Relevant Articles:


This article was written by Dividend Growth Investor. If you enjoyed this article, please vote for it by clicking the Buzz Up! button below.


Continue Reading »

The Plymouth Rock Company

The Plymouth Rock Company is a private insurer located in Massachusetts. The company is run by James M. Stone, and every year he puts out a shareholder letter with commentary on current events in the market. It's usually a good read, and the 2008 letter was just released.

The full letter is here. Look on page 8 and 9 for his commentary. Here is an excerpt that I found interesting:

"The nightmare scenario from here is one in which, at this time in 2010, people look back and say: the Banks and Brokers were bailed out, ditto the auto manufacturers; we had a stimulus package and a middle class tax cut; we ran huge Keynesian deficits; and interest rates were to zero - but we are still in trouble. Confidence in that scenario could plummet well below where it is today."

The annual letters going back to 1984 are at this page.

Since Plymouth Rock is private, the only way to own this company is through buying shares of Central Securities (CET), a closed end fund that has 31% of its net assets in this company.

This article was written by Stock Market Prognosticator. If you enjoyed this article, please vote for it by clicking the Buzz Up! button below.


Continue Reading »

Blind Faith In Capitalism?

When the rest of the market panics and a wild sell-off ensues, value investors calmly increase their market holdings. As the unemployment rate increases and more investors panic, value investors become giddy as they swallow up stocks at even more attractive prices. Is it blind faith? Where does this faith come from? As Buffett has said many times over the years...

"In the 20th Century alone, we dealt with two great wars; a dozen or so panics and recessions; virulent inflation that led to a 21.5% prime rate in 1980; and the Great Depression of the 1930s, when unemployment ranged between 15% and 25%."

Although there have been cyclical downturns in the past, how do we know that it's not "different this time", as doom and gloomers will assert in each and every downturn? Quite simply, it is an understanding of the effectiveness of the incentive system that is the basis of capitalism. As Buffett puts it in his 2008 letter to shareholders:

"Our economic system has worked extraordinarily well over time. It has unleased human potential as no other system has, and it will continue to do so. America's best days lie ahead."

Investors who study various economic measures through the course of history will find many of the recurring themes which make Buffett so positive. One is the positive effects that lower borrowing costs have on the economy. Another is the adaptive ability of businesses which react to shocks by eventually bringing supply and demand back in line with each other. Another is growth in productivity, as innovation drives increases in efficiency which allows workers to produce more per hour and thus become more valuable and thereby increase their standard of living.

While certain political leaders call for an end to capitalism, it is important to retain some perspective and consider how valuable this economic system has been and how valuable it will be in continuing to drive increases in our standard of living.

This article was written by Saj Karsan of Barel Karsan. If you enjoyed this article, please vote for it by clicking the Buzz Up! button below.


Continue Reading »

Build Your Own Income Fund

One of the best things about dividend stocks is the income they throw off. Now this may seem obvious, however it is worth repeating as it is that income received from stocks that provide a huge bulk of the return that you and other investors will receive through holding dividend stocks. As I was going through some of my old posts, I was reminded of an article at the Globe and Mail that presents the theory that an investor can forgo the huge fees charged by mutual fund companies and build a fund of their own.

In this article, the author suggests using income trusts, dividend paying stocks, and bonds to build the foundation of your own personal income fund. Not a new concept one something that dividend investors have been doing for a long time. However, what I was reminded of most was that for those of us who use individual stocks in our portfolios (I use both index funds and very select dividend stocks to build my portfolio) we are essentially in the business of building a mutual fund anyway. The bonus is that we have complete control over what goes in and out of that portfolio and most importantly, we have control over the fees that we pay! There are no extra redemptions fees or loads to suck away our returns.

Of course, I think that it is very important to point out that if you do plan on building a fund like this, then you had better have enough money to ensure that you can diversify completely. By choosing one income trust here, a stock there, and then throw in some bonds you are opening yourself up to way too much risk and as the market has shown us in the past few months, the people that have been hurt the most are the ones with too little diversification (true diversification that is).

This article was written by The Dividend Guy. You may email questions or comments to me at info@thedividendguyblog.com.


Continue Reading »

Stock Analysis: Abbott Laboratories (ABT)

Linked here is a detailed quantitative analysis of Abbott Laboratories (ABT). Below are some highlights from the above linked analysis:

Company Description: Abbott Laboratories is engaged in the discovery, development, manufacture and sale of a diversified line of healthcare products including: drugs, nutritional products, diabetes monitoring devices and diagnostics.

Fair Value: I consider four calculations of fair value, see page 2 of the linked PDF for a detailed description:

  1. Avg. High Yield Price
  2. 20-Year DCF Price
  3. Avg. P/E Price
  4. Graham Number
ABT is trading at a discount to 1.) and 3.) above. If I exclude the high and low valuations and average the remaining two, ABT is trading at a slight premium. ABT earned a Star in this section since it is trading at a fair value.

Dividend Analytical Data: In this section I consider five factors, see page 2 of the linked PDF for a detailed description:
  1. Rolling 4-yr Div. > 15%
  2. Dividend Growth Rate
  3. Years of Div. Growth
  4. 1-Yr. >; 5-Yr Growth
  5. Payout 15% of avg.
ABT earned two Stars in this section for 3.) and 4.) above. ABT has paid a cash dividend to shareholders every year since 1926 and has increased its dividend payments for 37 consecutive years. Its one year dividend growth rate exceeded its 5-year growth rate. This could indicate the growth rate is accelerating.

Dividend Income vs. MMA: Why would you assume the equity risk and invest in a dividend stock if you could earn a better return in a much less risky money market account (MMA)? This section compares the earning ability of this stock with a high yield MMA. Two items are considered in this section, see page 2 of the linked PDF for a detailed description:
  1. NPV MMA Diff.
  2. Years to > MMA
ABT earned both of the available Stars in this section. The NPV MMA Diff. of the $9,495 is in excess of the $2,500 minimum I look for in a stock that has increased dividends as long as ABT has. ABT's current yield of 3.63% exceeds the 3.17% estimated 20-year average MMA rate.

Other: ABT is a member of the S&P 500, a Dividend Aristocrat and a member of the Broad Dividend Achievers™ Index. ABT has a relatively strong product pipeline, with possible significant launches in both the medical device and pharmaceutical areas. The company is financially sound, with a strong balance sheet, excellent return on capital employed and a relatively low dividend payout ratio. In 2008, operating revenues consisted of pharmaceuticals 57%, nutritionals 17%, diagnostics 11%, vascular 8% and other products 7%. In total, foreign sales accounted for 52% of all 2008 sales.

Like all pharmaceutical companies, ABT is facing challenges to their branded patents, drug development and regulatory issues. However, they appear to be in a better position than most of their peers. Other risks include lower-than-expected Humira sales, new generic competition to Synthroid and Biaxin and pipeline disappointments.

Conclusion: ABT earned one Star in the Fair Value section, earned two Stars in the Dividend Analytical Data section and earned two Stars in the Dividend Income vs. MMA section for a net total of five Stars. This quantitatively ranks ABT as a 5 Star-Strong Buy.

Using my D4L-PreScreen.xls model, I determined the share price could increase to $65.25 before ABT's NPV MMA Differential fell to the $3,000 that I like to see. At that price the stock would yield 2.45%.

Resetting the D4L-PreScreen.xls model and solving for the dividend growth rate needed to generate the needed $3,000 NPV MMA Differential, the calculated rate is 3.2%. This dividend growth rate is significantly below the 8.4% used in this analysis, thus providing a margin of safety. ABT has a risk rating of 1.50 which classifies it as a medium risk stock.

ABT was last reviewed on ABT on July 14, 2008 with0-Star Avoid rating due primarily to its valuation. At the time ABT was trading at $56.43. Since that time I have watched ABT for the right time to initiate a position, and it is currently very close to my buy price of $42.53, and is within range when I add a 5% quality premium to the buy price. For additional information, including the stock's dividend history, please refer to its data page.

Disclaimer: Material presented here is for informational purposes only. The above quantitative stock analysis, including the Star rating, is mechanically calculated and is based on historical information. The analysis assumes the stock will perform in the future as it has in the past. This is generally never true. Before buying or selling any stock you should do your own research and reach your own conclusion. See my Disclaimer for more information.

Full Disclosure: At the time of this writing, I held no position in ABT (0.0% of my Income Portfolio).

What are your thoughts on ABT?

Recent Stock Analyses:
This article was written by Dividends4Life. If you enjoyed this article, please vote for it by clicking the Buzz Up! button below.


Continue Reading »

Weekend Reading Links - April 12, 2009

For your weekend reading pleasure, the articles listed below contain some of the best dividend and value investing insights found on the web. They were written by various members of the Dividend Investing and Value Network (DIV-Net) over the past week:

Articles From DIV-Net Members

There are some really good articles here, please take time and read a few of them.

If you enjoyed this article, please vote for it by clicking the Buzz Up! button below.


Continue Reading »

Dividend Increases - April 11, 2009

Dividend increases continue at a slow pace, but they do continue to occur. Dividend investors always appreciate companies treating their shareholders to increased cash dividends. This week's dividend increases include:

  • Genesis Energy (GEL) increased its Qtr. Distribution by 2.3% to $0.3375/share (Yield: 11.49%
  • TJX Companies (TJX) raised its Qtr. Dividend to $0.12/share (Yield: 1.74%)
  • Plains All American (PAA) boosts its Cash Distribution by 4.6% to $0.905/unit (Yield: 9.20%)
  • Tanger Factory Outlet (SKT) bumps its Qtr. Dividend to $0.3825/share, (Yield: 4.36%)
The dividend slashers continue to outnumber the raisers, but the raisers are still there, if you look for them. For more companies around the world with a long string of consecutive dividend increases, see my updated Stock Ideas page.

Full Disclosure: No position in any of the aforementioned securities.

This article was written by Dividends4Life. If you enjoyed this article, please vote for it by clicking the Buzz Up! button below.


Continue Reading »

Special Dividends

Most investors view stocks as lottery tickets – they buy and hope for the greater fool theory to kick in order to sell at a profit. More often than not however these investors lose a lot of money in the stock market, as they never seem to learn that stocks represent small portions of a business, which sells products or services and hopefully earns a decent profit while building on to its asset base.

Many investors have taken a beating recently, especially as the recession and bear market kicked in earlier in 2008. Some are bailing out of stocks completely, while seeking the relative safety of Treasury Bonds or Certificates of Deposit. Some investors however have seen the current bear market as an opportunity to load up on cheap stocks, which are trading below the net levels of cash on their balance sheets. The net-net strategy was popularized by Ben Graham who bought stocks after the Great Depression at steep discounts to the net asset values per shares realizing huge profits in the process.

Imagine a company ABC that has 1 million shares issued and outstanding trading at $0.50/share, has zero debt and no liabilities, and also has $1 million in cash and equivalents on its balance sheet. Now further imagine that the company is at least breaking even in terms of earnings. Would you pay $0.50/share for an asset that has a value of at least $1.00?
Now the answer is not as straightforward since one needs to determine what catalyst would bring the price closer to $1.00. If the company decides to spend the cash on an ill-fated venture, then the value of the stock would drop. However if the company decides to liquidate or pay a special dividend to shareholders, then the stock should be worth more than $0.50/share.

Most recently I have seen several small cap companies announcing a special dividend:

Back on March 16, FortuNet (FNET) announced that it would ask shareholders to approve a special $2.50 cash dividend on its April 17 meeting. As a result the stock price rallied 75.2% in a single day to $2.40/share. FNET earned $0.25/share in 2008 and has almost $2.75/share in total cash and investment securities as of 12/31/2008.

Back on December 5 Eden bioscience (EDEN) announced it would be winding down its operations. The stock rallied 77% on the news. The company had $1.80/share in cash. A potential issue is that winding down operations could cost money.

A company I am currently looking at from a value-investing standpoint is TheStreet.com (TSCM). Currently the online stock market content provider has $72.4 million in its coffers, versus total liabilities of $19 million, for a net $53.4 million or $1.76/share in cash. I like the fact that TSCM is paying out a quarterly dividend of $0.025/share. I would be interested in TSCM on dips below $1.50.

Relevant Articles:

- Best CD Rates
- 40 Value Stocks that Graham Would Buy
- Average Durations of Previous Bear Markets
- The Dividend Edge
- Why dividends matter?


This article was written by Dividend Growth Investor. If you enjoyed this article, please vote for it by clicking the Buzz Up! button below.


Continue Reading »

Net Current Asset Value Update

In November 2008, I reproduced a list of some stocks that were selling below Net Current Asset Value. I updated that list in January 2009, and do so again now.

I am using the closing price on April 7, 2009. There are a few standout performers on the list, but the majority have gotten cheaper on an absolute basis since October 31, 2008.


Judging by the performance of some of them, many on the list appear to be value traps, snaring investors with false promises.

Here is some more info on the strategy.

This article was written by Stock Market Prognosticator. If you enjoyed this article, please vote for it by clicking the Buzz Up! button below.


Continue Reading »

Value Investing Arbitrage?

Occasionally, an investor may believe a stock to be undervalued based on his estimate of the business' underlying value. If his estimate is correct, he should generate excellent returns over the next several years if the stock price converges to the underlying business' value. Sometimes, however, an announced merger transaction will allow this investor to buy this stock at an even cheaper price! Consider TAT Technologies (TATTF), which we've discussed as a potential value play.

TATTF already owns 60% of Limco-Piedmont (LIMC), an aircraft maintenance provider with a market cap of $30 million, no debt, and cash of $32 million! TATTF now wants to own the other 40% of Limco-Piedmont, and has offered LIMC shareholders 1 TATTF share for every two LIMC shares.

With TATTF's share price at $4.90, and Limco-Piedmont's at $2.24, investors are offered the opportunity to acquire TATTF's stock at an additional 10% off! (An investor looking to make a quick buck could purchase two LIMC shares and short-sell one TATTF share for a handsome profit margin.)

Of course, nothing is a sure thing. Although TATTF controls Limco-Piedmont and therefore the merger should be quick and easy, unknown factors could come along that derail the transaction. As such, investors should ensure they understand LIMC and are comfortable with the investment as is. However, since LIMC is already fully consolidated as part of TATTF (due to its controlling interest), a share of TATTF represents a significant interest in LIMC already, and therefore shareholders of TATTF should already know the acquisition target well.

This article was written by Saj Karsan of Barel Karsan. If you enjoyed this article, please vote for it by clicking the Buzz Up! button below.


Continue Reading »

7 Risks of International Investing

I am large believer in holding international assets as part of my asset allocation in my dividend portfolio. However, like all assets international equities are not the ticket to wealth on their own and must be part of a larger portfolio strategy. All assets carry risks that can impact results, and international holdings are no different. In an article provided by the SEC from some time ago, they list seven additional risks that investors need to be cautious of when considering international investments.

1. Changes in currency exchange rates - when changes occur between currencies, it can impact your investments dramatically. Canadian investors saw that extensively with their U.S. holdings in the past year.
2. Dramatic changes in market value - foreign markets, like all markets, can experience dramatic changes in market value.
3. Political, economic and social events - it is difficult for investors to understand all the political, economic, and social factors that influence foreign markets.
4. Lack of liquidity - oreign markets may have lower trading volumes and fewer listed companies. They may only be open a few hours a day. Some countries restrict the amount or type of stocks that foreign investors may purchase. You may have to pay premium prices to buy a foreign security and have difficulty finding a buyer when you want to sell.
5. Less information - many foreign companies do not provide investors with the same type of information as U.S. public companies. It may be difficult to locate up-to-date information, and the information the company publishes my not be in English.
6. Reliance on foreign legal remedies - If you have a problem with your investment, you may not be able to sue the company in the United States. Even if you sue successfully in a U.S. court, you may not be able to collect on a U.S. judgment against a foreign company. You may have to rely on whatever legal remedies are available in the company’s home country.
7. Different market operations - Foreign markets often operate differently from the major U.S. trading markets.

Some of these risks may not be as intense if you are a Canadian investing in the U.K. for example. However, if you are a Canadian investing in a South America, then some of these risks may become more prevalent. That is why, with all these added risks, my view is that it is better to use a low fee index fund or ETF that invests in a broad international geography as opposed to regional index funds. This will help to spread out your risk and expose you to a higher number of international opportunities.

This article was written by The Dividend Guy. You may email questions or comments to me at info@thedividendguyblog.com.


Continue Reading »

Stock Analysis: Progress Energy, Inc. (PGN)

Linked here is a detailed quantitative analysis of Progress Energy, Inc. (PGN). Below are some highlights from the above linked analysis:

Company Description: Progress Energy, Inc. is a diversified energy company that owns two electric utilities serving approximately 3.1 million customers in North Carolina, South Carolina, and Florida.

Fair Value: I consider four calculations of fair value, see page 2 of the linked PDF for a detailed description:

  1. Avg. High Yield Price
  2. 20-Year DCF Price
  3. Avg. P/E Price
  4. Graham Number
PGN is trading at a discount to 1.) and 3.) above. If I exclude the high and low valuations and average the remaining two, PGN is trading at a slight discount. PGN earned a Star in this section since it is trading at a fair value.

Dividend Analytical Data: In this section I consider five factors, see page 2 of the linked PDF for a detailed description:
  1. Rolling 4-yr Div. > 15%
  2. Dividend Growth Rate
  3. Years of Div. Growth
  4. 1-Yr. > 5-Yr Growth
  5. Payout 15% of avg.
PGN earned one Star in this section for 3.) above. PGN has paid a cash dividend to shareholders every year since 1937 and has increased its dividend payments for 21 consecutive years.

Dividend Income vs. MMA: Why would you assume the equity risk and invest in a dividend stock if you could earn a better return in a much less risky money market account (MMA)? This section compares the earning ability of this stock with a high yield MMA. Two items are considered in this section, see page 2 of the linked PDF for a detailed description:
  1. NPV MMA Diff.
  2. Years to > MMA
PGN earned both of the available Stars in this section. The NPV MMA Diff. of the $10,999 is in excess of the $7,500 minimum I look for in a stock that has increased dividends as long as PGN has. PGN's current yield of 6.91% exceeds the 3.17% estimated 20-year average MMA rate.

Other: PGN is a member of the S&P 500 and a member of the Broad Dividend Achievers™ Index. Having discontinued the higher risk synthetic fuel business, PGN can now focus on its regulated utilities business in the Carolinas and Florida, which should enjoy above average customer growth and generally supportive regulatory environment. Going forward, the company's primary focus is on the end-use and wholesale electricity markets in its service region. Risks include unfavorable regulatory rulings and a deeper than anticipated residential decline in Florida.

Conclusion: PGN earned one Star in the Fair Value section, earned one Star in the Dividend Analytical Data section and earned two Stars in the Dividend Income vs. MMA section for a net total of four Stars. This quantitatively ranks PGN as a 4 Star-Buy.

Using my D4L-PreScreen.xls model, I determined the share price could increase to $42.81 before PGN's NPV MMA Differential fell to the $7,500 that I like to see. At that price the stock would yield 5.88%.

Resetting the D4L-PreScreen.xls model and solving for the dividend growth rate needed to generate the needed $7,500 NPV MMA Differential, the calculated rate is -1.7%. This negative dividend growth rate is below the 0.8% used in this analysis, thus providing a margin of safety. PGN has a risk rating of 1.75 which classifies it as a medium risk stock.

Although PGN is quantitatively rated as a buy and it is trading below my buy price of $37.00, I have concerns about its dividend in the near-term. The company has experienced the adverse impact of the current economic recession while remaining intent on enhancing operational excellence, strengthening financial flexibility and growth.

In 2007 and 2008, PGN's free cash flow per share was negative as a result of lower operating cash flows and higher capital spending. After seeing $2.3 billion of capital expenditures in 2008, PGN plans to spend approximately $6.3 billion over the next three years from 2009 through 2011, with about $2 billion spent in each year. For additional information, including the stock's dividend history, please refer to its data page.

Disclaimer: Material presented here is for informational purposes only. The above quantitative stock analysis, including the Star rating, is mechanically calculated and is based on historical information. The analysis assumes the stock will perform in the future as it has in the past. This is generally never true. Before buying or selling any stock you should do your own research and reach your own conclusion. See my Disclaimer for more information.

Full Disclosure: At the time of this writing, I was long in PGN (3.0% of my Income Portfolio).

What are your thoughts on PGN?

Recent Stock Analyses:
This article was written by Dividends4Life. If you enjoyed this article, please vote for it by clicking the Buzz Up! button below.


Continue Reading »
Weekend Reading Links - April 5, 2009

For your weekend reading pleasure, the articles listed below contain some of the best dividend and value investing insights found on the web. They were written by various members of the Dividend Investing and Value Network (DIV-Net) over the past week:

Articles From DIV-Net Members

There are some really good articles here, please take time and read a few of them.

If you enjoyed this article, please vote for it by clicking the Buzz Up! button below.


Continue Reading »

QCOM: Stock Analysis for Dividend Growth Portfolio

Qualcomm manufactures and markets digital wireless telecommunications products and services based on its code division multiple access (CDMA) technology and other wireless communication technologies. QCOM is neither a dividend aristocrat nor a dividend achiever. QCOM has started showing some dividend growth trends in last five years. My objective here is to understand if QCOM has any potential to be a dividend investment.

Trend Analysis

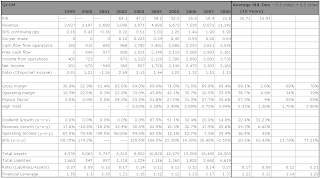
This section looks at trends for past 10 years of corporation's revenue and profitability. These parameters should show consistently growth trends. The trend charts and data summary are shown in images below (click to enlarge).

  • Revenue: In general, after 2001, QCOM has stable and consistent growth in revenue. The average revenue growth for last 5 years is 24.3% (with 6.62% standard deviation).
  • Cash Flows: Relatively increasing trend for operating cash flow. In the last five years, the corporation's operating cash flows are consistently higher than net income. The concern I have is the free cash flow is more or less similar to net income. There is very little room for flexibility in allocating cash for dividends.
  • EPS from continuing operation: In general, the EPS also has an increasing trend since year 2003 with average growth rate as 50%. Most of that growth is coming in 2003 and 2004. Since 2005, the EPS growth rate has been approximately 20%.
  • Dividends per share: Dividends per share are consistently growing for the last 5 years.

Risk Parameter Calculation

Here I use the corporation's financial health to assign a risk number for measuring risk-to-dividends. I have discussed this in more detail at Dividend Tree. The risk number for risk-to-dividends is 1.57. This is a low risk category as per my 3-point risk scale.

Quality of Dividends

This section measures the dividend growth rate, duration of growth, consistency over a period of past five years.
  • Dividend growth rate: The average dividend growth of 34.3% is less than average EPS (50%) growth rate. However, when we look at last three years alone, the dividend growth and EPS growth are very similar (closer to 20% for both).
  • Duration of dividend growth: Dividends have continuously grown for the last 5 years.
  • 4 year rolling dividend growth rate for past ten years: No
  • Payout factor: In the past 5 years, it has been consistently less than 35%. This is good aspect.
  • Dividend cash flow vs. income from MMA: Here, I analyze how the dividend cash flow stacks up against the income from FDIC insured money market account. The baseline assumption is (a) stock is yielding 1.6%; and (b) MMA yield is 3.4%. Considering the last 3 year average dividend growth rate of 22.4%, the stocks dividend cash flow at the end of 10 years is 2.15 times MMA income.
Fair Value Calculation

This section determines what price I should pay to buy a given stock
  • Net present value (NPV) price based on 20 year DCF: $66.17
  • Average high yield price calculated based on past 10 years: $21.0
  • Pricing based on past 10 year relative price-to-earnings ratio. $63.0
  • Pricing based on price-to-earnings ratio of 12: $21.2
  • Graham number: $17.9
The range of fair value is calculated as $24.5 to $37.8. This determined by taking average (for high value) of above five parameters and then subtracting it with half the standard deviation (for low value).

Qualitative Analysis

The strength of QCOM's business is its ownership of CDMA technology, royalty-based cash flow of more than USD 1 billion dollars, most of the competitors are struggling, and a strong technology-driven roadmap. QCOM is on path to become Google of wireless communication chipset. Contrarily, the concerns I have with QCOM is it operates in a cyclic industry and never ending legal battles.
  • This quantitative analysis shows that, in last 5 years QCOM has had significant growth in revenue. It continues to maintain 60%+ gross margins and 30%+ operating margins. However, the EPS has high volatility.
  • Notwithstanding the higher operating cash flow, the recession driven slow down is likely to affect its EPS.
  • The concern I have is that the company has increased its debt significantly (relative to its own historical standards).
  • Assuming that the corporation's existing trends in profitability and growth continue 'as is', the low payout factor will allow the corporation to continue to maintain (if not raise) the dividends.
Conclusion

The stocks current risk-to-dividend number is 1.57 (low risk category). In addition, the dividend cash flow is 2.15 times the MMA income based on average dividend growth rate of 22%. Moving forward, I expect dividend growth rate to slow down (10% to 12% range). In that case, the price will have to drop down to $25.80 for dividend income to be twice MMA income. This pricing of $25.80 is also very close to my low range of my fair value. In addition, there is no dividend growth for year 2009.

I like QCOM's technologically-driven dominant market position and its low risk-to-dividends. However, for a potentially good dividend investment, I would wait for its price to get closer to my low end (i.e. $24.8) of the fair value range.

Full Disclosure: No position at the time of this writing.

This article was written by Dividend Tree. You may email questions or comments to me at dividendtree@gmail.com.


Continue Reading »